How to Use a Gantt Chart in Confluence: 7 Easy Steps [2026]
Project timelines can become confusing when tasks, owners, deadlines, and dependencies live across separate Confluence pages. A simple list may show what needs doing, yet it rarely shows how one delay affects the entire plan.
That uncertainty creates missed handoffs, unclear priorities, and long status meetings. A project can appear on schedule while a single blocked task quietly threatens the launch date.
Here’s the practical solution: use a Gantt chart to turn project work into a visual timeline. You can build one in Confluence with a suitable planning app, connect it to your project information, and keep the schedule visible beside your team’s knowledge.
This guide explains how to use a Gantt chart in Confluence in seven easy steps, with examples, setup advice, and ways to keep the timeline accurate throughout 2026.
How to Use a Gantt Chart in Confluence: 7 Easy Steps
A Gantt chart in Confluence is a visual project timeline that displays tasks, dates, durations, milestones, owners, and dependencies on a shared Confluence page. Confluence does not provide every advanced Gantt capability by default, so you usually need a compatible planning app, macro, or connected project workspace.
The core process is straightforward. Define the project, choose a suitable charting method, add work items, connect dependencies, publish the timeline, and maintain it during delivery.
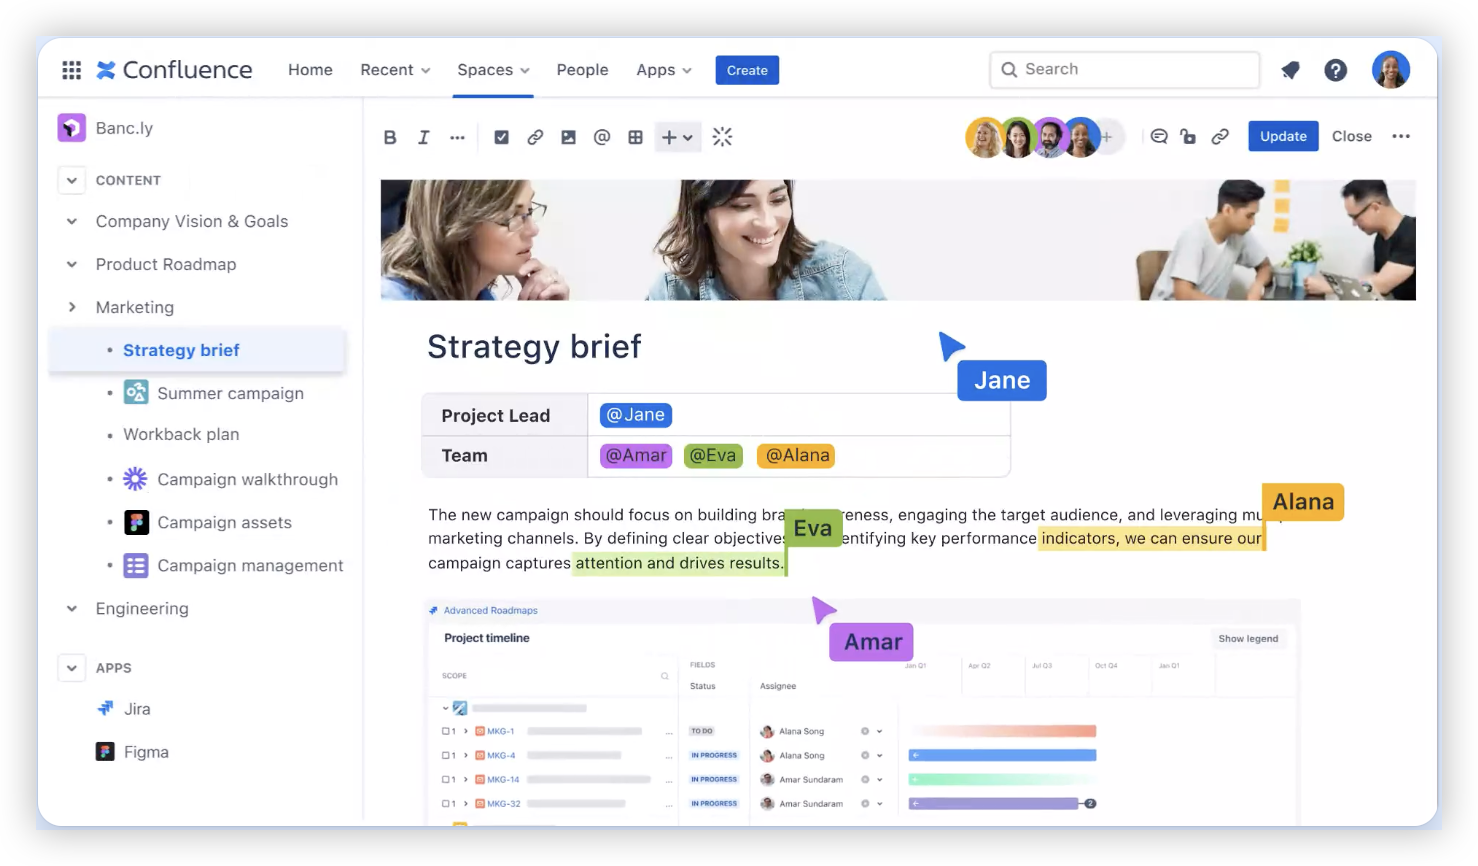
1. Define the project scope before building the chart
Start with a clear project outcome. Write one sentence describing what the team must deliver and when the result should be ready.
For example, a website redesign might include five major outcomes:
- Approve the new page structure.
- Complete interface design.
- Build reusable page components.
- Finish content migration and testing.
- Launch the updated website.
These outcomes give your Gantt chart a useful structure. Without clear scope, the timeline becomes a long collection of activities with no meaningful finish line.
Here’s why: every task on the chart should support a visible project result. If a task has no clear connection, review whether it belongs in the schedule.
2. Choose how you will create the timeline in Confluence
Confluence can host project information, decisions, requirements, and status updates. A Gantt chart usually requires an additional planning function.
You can create the timeline through a Confluence Marketplace app, an embedded project view, or a project management platform connected to your Confluence space.
Compare the options using practical questions:
- Can you create tasks and milestones directly from the page?
- Can the chart show task dependencies?
- Can several people edit dates and assignments?
- Does the timeline update when project work changes?
- Can you control access for different teams?
- Can you display the chart clearly on smaller screens?
For a small marketing campaign, a lightweight macro may be enough. For a product launch involving engineering, design, compliance, and support, you may need a connected project management system.
3. Create the task hierarchy
Build the chart from broad work packages down to actionable tasks. A useful hierarchy helps people understand both the project structure and their immediate responsibilities.
For a mobile app release, your hierarchy might look like this:
- Product preparation
- Confirm release scope.
- Approve acceptance criteria.
- Engineering
- Complete application updates.
- Run integration testing.
- Launch readiness
- Prepare support guidance.
- Complete release approval.
Keep task names specific. “Testing” is vague. “Complete payment flow regression testing” gives the owner a clearer result.
Let me explain: a Gantt chart works best when each task represents a deliverable or a verifiable action. Broad labels make progress difficult to measure.
4. Add start dates, end dates, and task owners
Assign realistic dates to every actionable task. Use a start date and end date for work that spans several days. Use a milestone for a point-in-time event.
For example:
| Work item | Start | End | Owner | Type |
|---|---|---|---|---|
| Approve interface direction | March 3 | March 5 | Design lead | Task |
| Build account settings | March 6 | March 14 | Engineering lead | Task |
| Release approval | March 21 | March 21 | Product manager | Milestone |
Use working days when your planning system supports them. A five-day task should not silently become a seven-day task because weekends were counted.
You might be wondering: how detailed should the schedule be? Start with tasks that take between one day and two weeks. Break longer activities into smaller checkpoints.
5. Connect dependencies between tasks
Dependencies show the order in which work must happen. The most common relationship is finish-to-start, where one task must finish before another begins.
For example, engineering may need approved interface designs before development starts. Testing may require a completed build. Launch approval may depend on successful testing.
Connect these relationships in your chart:
- Interface approval → application development.
- Application development → integration testing.
- Integration testing → release approval.
Dependencies make schedule risk visible. If interface approval slips by three days, the chart can show which later activities may move.
The best part? You can focus attention on the chain of work that controls the finish date, rather than treating every task as equally urgent.

6. Add milestones and review points
Milestones mark important decisions, approvals, releases, or completed stages. They help executives and project contributors scan progress quickly.
Useful milestones include:
- Scope approved.
- Design signed off.
- Development complete.
- Testing passed.
- Launch approved.
Place milestones at meaningful points. Adding one to every minor activity reduces their value and makes the chart harder to read.
A milestone can also create a useful review rhythm. For example, a team may review its timeline after design approval, during testing, and before launch.
7. Publish the chart and maintain it throughout delivery
Embed the Gantt chart on a central Confluence page. Add a short explanation of the project goal, current status, key risks, and the next review date.
Then establish a maintenance routine:
- Review progress during the regular project meeting.
- Update completed work promptly.
- Adjust dates when approved changes affect the schedule.
- Record the reason for major timeline changes.
- Escalate blocked dependencies before they threaten milestones.
A timeline becomes unreliable when it reflects the original plan instead of current reality. Assign one person to coordinate updates, while task owners report changes for their areas.
Use a status note beside the chart. A simple update might say, “Testing is two days behind because the payment service needs a fix. Launch approval remains unchanged if the fix arrives by Thursday.”
What a Gantt Chart Adds to a Confluence Workspace
Confluence is useful for centralizing project context. A timeline adds the scheduling layer that ordinary pages often lack.
Imagine a launch page containing requirements, meeting notes, decisions, risks, and a Gantt chart. A new contributor can understand the project without searching through multiple spaces.
The chart also turns static planning into a visual conversation. People can discuss why a task moved, which dependency caused the change, and whether the final milestone remains achievable.
Here’s why: project delays usually involve relationships between tasks. A list may show that testing is late, while a Gantt chart can show that testing delays approval and launch.
How to Organize the Timeline for Clearer Planning
Use summary rows for major phases and smaller tasks beneath them. Keep the hierarchy shallow enough for quick scanning.
For a software release, the phases could include discovery, design, development, quality assurance, and launch. Each phase should contain only the work needed to reach its next checkpoint.
Color can help distinguish work types, such as design, engineering, review, and external approval. Use a small visual system so the chart remains understandable to people with different accessibility needs.
For example, a red bar might indicate an active risk, while a blue bar represents planned work. Add text labels as well, because color alone can exclude some readers.
How to Read Progress, Slippage, and the Critical Path
A Gantt chart usually displays planned duration alongside actual progress. Look for tasks that have passed their end date without completion, especially when later work depends on them.
The critical path is the chain of dependent activities that determines the earliest possible finish. If one task on that chain moves, the final milestone may move too.
Consider a product launch with this sequence:
- Security review takes three days.
- Fixes take four days.
- Final verification takes two days.
- Release approval takes one day.
That chain takes ten working days. Adding more people to unrelated tasks will not shorten it unless the chain itself changes.
Review slack as well. A task with spare time may move without affecting the launch. A task with no spare time deserves earlier attention.
Common Mistakes When Adding Gantt Charts to Confluence
A common mistake is creating a beautiful chart with no maintenance owner. The visual design may be impressive, yet outdated dates quickly damage trust.
Another mistake is adding every possible activity. A timeline with hundreds of tiny tasks becomes difficult to scan. Keep detailed execution tracking in the project workspace, then show the most useful level on the Confluence page.
Teams also sometimes connect dependencies incorrectly. If a task can begin before another finishes, do not create a false restriction. Incorrect links can make the project appear slower than it really is.
Finally, avoid treating the chart as a replacement for discussion. A timeline shows relationships and timing. It does not explain a complex decision, unresolved risk, or changing customer expectation by itself.
How to Keep a Confluence Timeline Accurate
Set a weekly review for active projects. During the review, ask four practical questions:
- What finished since the last review?
- What is currently blocked?
- Which dates changed, and why?
- Which milestone is most at risk?
For shorter projects, update the timeline twice each week. For long projects, a weekly update may be enough, provided major changes are recorded immediately.
Use a change note when a date moves. “Content review moved from May 8 to May 10 because legal feedback arrived late” gives future readers useful context.
A chart should help people act. Keep current risks, decisions, and next actions close to the visual schedule, so readers can move from understanding to execution.
Gantt Chart Solution: ONES.com

Value Proposition
ONES.com combines project management and knowledge management in one platform. ONES Project can support timeline planning, while ONES Wiki can hold project context, decisions, and team guidance.
For teams seeking a Jira alternative with a connected knowledge workspace, this approach can reduce scattered planning and repeated status updates.
Core Capabilities
- Scattered task planning → ONES Project provides structured project spaces, tasks, and schedules → Teams can organize work around visible deliverables.
- Unclear dependencies → Dependency relationships connect related activities → Delays become easier to trace before they affect milestones.
- Repeated manual reporting → Built-in reporting gives teams a clearer progress view → Project meetings can focus on decisions and risks.
- Rigid planning fields → Custom workflows and custom fields capture project-specific information → Teams can track approval stages, risk levels, or release types.
- Inconsistent sprint execution → Sprint management supports iterative delivery → Agile teams can connect sprint work with broader release timing.
- Repetitive status actions → Automation handles recurring workflow transitions and notifications → Contributors spend less time updating routine states.
- Separated project knowledge → ONES Wiki stores related guidance and team knowledge → People can find planning context beside project work.
- Heavy plugin dependence → Jira-compatible workflows and native capabilities cover common planning needs → Teams may reduce the number of connected extensions.
- Deployment restrictions → ONES.com supports Cloud, On-Premise, Private Cloud, and Air-gapped deployments → Organizations can select an environment that fits their operating requirements.
ONES.com offers a free plan for up to 30 seats. Its self-hosted and cloud versions provide feature parity, which can simplify deployment decisions for teams with strict infrastructure requirements.
Application Scenarios
Product launch planning: A product team can manage design, engineering, quality assurance, and launch approvals in ONES Project. The team can keep release guidance and decision history in ONES Wiki.
Regulated development: A team with restricted-network requirements can use an air-gapped deployment. Its project schedule, workflows, and knowledge areas can remain within the controlled environment.
Cross-functional marketing campaigns: Marketing, design, sales, and legal teams can track campaign activities, approval stages, and deadlines through shared workflows. A timeline can reveal whether late approval threatens publication.
Common Challenges When Using Gantt Charts in Confluence
Challenge 1: The chart does not update when work changes
Problem: The timeline shows planned dates, while actual task progress lives elsewhere. People stop trusting the chart after several mismatches.
Solution: Connect the chart to the place where contributors manage work, or schedule a clear review routine. Assign one coordinator to check dates, dependencies, and milestones.
Challenge 2: The timeline contains too many tasks
Problem: Hundreds of bars make it difficult to identify the work that controls the outcome.
Solution: Show major work packages, critical activities, and milestones on the shared page. Keep granular execution details in the underlying project workspace.
Challenge 3: Dependencies are missing or inaccurate
Problem: The chart cannot show how one delay affects later work. Teams then discover schedule risk during a late meeting.
Solution: Add dependencies during planning and review them whenever scope changes. Ask owners to confirm whether each relationship is necessary.
Challenge 4: Different teams interpret status differently
Problem: One team marks work complete after coding, while another waits for testing and approval.
Solution: Define status meanings clearly. For example, “complete” may require implementation, review, testing, and acceptance.
Challenge 5: People cannot find the explanation behind a date
Problem: A moved deadline appears without context, creating confusion and repeated questions.
Solution: Add a short change note beside the chart. Link the timeline to relevant decisions, risks, and approval discussions in the same Confluence space.
FAQs
Can I create a Gantt chart directly in Confluence?
Confluence can display a Gantt chart through a compatible app, macro, or connected project management platform. The exact setup depends on your Confluence edition and the planning capability you choose. A native page can hold the timeline and supporting context, while a connected system may manage tasks, dependencies, owners, and progress. Check whether the option supports editing, permissions, and automatic updates before adopting it for an active project.
What should a Confluence Gantt chart include?
Include project phases, actionable tasks, start dates, end dates, owners, dependencies, milestones, and progress status. You can also add a short project summary, key risks, and the next review date. For example, a website launch chart might include design approval, development, content migration, testing, legal review, and release approval. Include enough detail for decisions without overwhelming readers with minor activities.
How often should I update the timeline?
Review an active project at least once each week. Update completed work and blocked tasks sooner when they affect a critical milestone. A launch team may need twice-weekly reviews during testing, while a long internal improvement project may need weekly updates. The right frequency depends on delivery speed, risk, and the number of connected activities. Assigning an owner prevents the chart from becoming outdated.
Are Gantt charts suitable for agile teams?
Yes. Agile teams can use Gantt charts to show release goals, sprint windows, dependencies, and external approvals. The chart should complement sprint planning rather than replace it. For example, individual stories can remain in sprint tracking, while the Gantt view shows how several sprints support a product release. Keep the timeline focused on milestones and cross-team coordination.
What is the difference between a Gantt chart and a project task list?
A task list shows work items and may include owners or statuses. A Gantt chart adds time, duration, sequencing, and visual relationships between activities. For example, a task list may say that testing is pending. The chart can show that testing begins after development, lasts four days, and must finish before release approval. That scheduling context helps you understand the effect of delay.
Can ONES.com replace Confluence for project planning?
ONES.com can combine project management and knowledge management through ONES Project and ONES Wiki. ONES Project supports planning, workflows, sprints, reporting, automation, and custom fields. ONES Wiki supports shared team knowledge. Whether it replaces your current Confluence setup depends on your requirements, migration plans, deployment preferences, and collaboration habits. Teams comparing platforms can evaluate it as a Jira alternative with connected knowledge capabilities.
Conclusion
Using a Gantt chart in Confluence starts with clear scope, a practical task hierarchy, realistic dates, connected dependencies, and visible milestones. The seven-step process helps you move from scattered project details to a timeline people can understand.
Keep the chart current through regular reviews. Show the work that matters, record major schedule changes, and connect the timeline with decisions, risks, and project knowledge.
But here’s the truth: a Gantt chart cannot rescue unclear ownership or constantly changing priorities by itself. It becomes valuable when your team uses it to discuss timing, dependencies, and action.
If Confluence and your project tracker feel disconnected, a unified platform such as ONES.com may provide another approach. The right setup gives you both a readable schedule and the project context needed to deliver confidently.