How to Show the Gantt Chart in Microsoft Project [2026]
Microsoft Project can hide the Gantt Chart when you open a different view, use a split layout, or adjust the window accidentally. That creates a frustrating problem: your tasks may still be present, but the timeline disappears when you need it most.
The longer you work without the chart, the harder it becomes to check dependencies, spot delays, and explain the schedule to your team. You may even rebuild parts of the plan unnecessarily.
But here's the truth: showing the Gantt Chart usually takes only a few clicks. I’ll walk you through the fastest method, explain why it sometimes disappears, and show how to restore a useful timeline view in Microsoft Project.
How to Show the Gantt Chart in Microsoft Project
To show the Gantt Chart in Microsoft Project, open the View tab and select Gantt Chart. Microsoft Project will restore the task grid and timeline pane.
Use these steps when the Gantt Chart is missing or another project view is active:
Open your project in Microsoft Project.
Select the View tab on the ribbon.
Find the Task Views group.
Click Gantt Chart.
Check that the left side shows task information and the right side shows timeline bars.
The Gantt Chart view normally displays task names, durations, start dates, finish dates, relationships, milestones, and progress bars. If you see only task rows, the timeline pane may be hidden or compressed.
Restore the timeline pane
If the task grid appears but the chart area does not, place your pointer on the vertical divider between the grid and timeline. Drag the divider toward the left until the chart becomes visible.
You can also maximize the Microsoft Project window. A narrow application window may reduce the timeline to a sliver, making the chart appear missing.
Use the View tab when another layout is active
Microsoft Project includes several views, including Task Sheet, Network Diagram, Calendar, and Task Usage. Each view highlights different planning information.
If you are in Task Sheet, you may see task details without timeline bars. Select View > Gantt Chart to return to the standard schedule layout.
Switch between common Gantt Chart layouts
Some Microsoft Project editions show multiple Gantt-related choices, such as Gantt Chart, Tracking Gantt, and Detail Gantt.
Gantt Chart: Shows the planned schedule and task relationships.
Tracking Gantt: Compares current progress with a saved baseline.
Detail Gantt: Provides additional schedule analysis for selected tasks.
For everyday planning, choose the regular Gantt Chart view. For schedule variance, choose Tracking Gantt after you have saved a baseline.
Why the Gantt Chart May Disappear
A missing chart does not always mean your project plan is damaged. In most cases, Microsoft Project is showing a different view, hiding a pane, or applying a layout that changes the display.
Here's why: Microsoft Project separates task information from the visual timeline. You can keep the same activities while changing how they appear on screen.
You opened a different project view
Views such as Resource Sheet and Network Diagram replace the normal Gantt layout. Your schedule remains available, but the timeline is no longer the main display.
For example, Resource Sheet focuses on people, equipment, and costs. Network Diagram focuses on task relationships. Neither view is designed to show standard horizontal Gantt bars.
The timeline area is too narrow
When the timeline pane becomes extremely narrow, bars can look absent. This often happens after dragging the divider between the task grid and chart area.
Move the divider slowly until you can see dates across the top and horizontal bars beneath them.
A filter hides most activities
A filter may display only incomplete tasks, critical tasks, or a selected category. If the filter returns few activities, the chart can look empty.
Open the View tab and inspect the filter controls. Choose All Tasks or clear the active filter when you need the complete schedule.
The timescale is showing the wrong period
The chart may contain bars, but they can sit outside the visible date range. This is common when a plan spans several months and the window is zoomed into one week.
Use the timescale controls to zoom out. A broader view helps you see the entire plan, while a narrower view helps you inspect daily activity.
Adjust the Gantt Chart for Better Schedule Visibility
Showing the chart is only the first step. A useful Gantt Chart should make timing, dependencies, and progress easy to understand.
The best part? You can improve readability without changing the underlying task schedule.
Choose a practical timescale
Right-click the timescale at the top of the chart to adjust its units. You can display days, weeks, months, quarters, or years.
Use weeks for a short implementation plan. Use months for a product launch lasting several quarters. Use days when coordinating detailed field work.
| Planning need | Useful timescale |
|---|---|
| Daily coordination | Days or weeks |
| Monthly delivery planning | Weeks and months |
| Executive schedule review | Months or quarters |
| Long-term portfolio planning | Quarters or years |
Fit the entire project on screen
Use the zoom controls to see the whole project duration. This gives you a quick overview of major phases, milestones, and late activities.
A full-project view works well during status meetings. You can then zoom in when someone asks about a specific task sequence.
Display the columns you actually need
The left side of the Gantt Chart can become crowded with unnecessary columns. Keep practical fields such as Task Name, Duration, Start, Finish, and Predecessors.
Remove columns that distract from schedule review. A cleaner grid gives you more room for the timeline without reducing useful information.
Highlight critical activities
Critical tasks influence the project finish date. Microsoft Project can display them with a different bar color, making schedule risk easier to spot.
For example, if testing has no available time buffer, a delay there may push the launch date. Highlighting critical activities helps you investigate that risk first.
Show milestones clearly
Milestones represent important events with zero duration, such as approval received, design complete, or product released.
Use milestone symbols and clear names. “Security review complete” tells your team more than “Checkpoint 3.”
Show Progress on the Gantt Chart
Microsoft Project can show planned work and actual progress on the same timeline. This helps you compare expectations with current delivery.
Let me explain: a basic Gantt Chart answers when work should happen. A tracking view helps answer whether the work is happening as planned.
Save a baseline before measuring variance
A baseline records the approved schedule at a specific point. Microsoft Project can then compare current dates against that plan.
Before saving a baseline, confirm that task durations, dependencies, calendars, and milestone dates are correct. Otherwise, later comparisons may be misleading.
Use Tracking Gantt for schedule comparison
Open the View tab and choose Tracking Gantt. This view can show baseline bars alongside current task bars.
Suppose a design task was planned to finish on March 10 but now finishes on March 17. The offset between the bars makes the seven-day delay visible.
Enter actual progress carefully
You can update progress using percentage complete, actual start dates, actual finish dates, or remaining duration.
A task marked 80 percent complete should reflect real work completed. If the team has completed testing but still faces approval work, the percentage should reflect that remaining effort.
Review the critical path after updates
Progress changes can alter the critical path. A task that was previously flexible may become urgent after a predecessor slips.
Review critical activities after major updates. This simple habit helps you focus attention where it can protect the final delivery date.
Use Split Views and Detail Panes
Microsoft Project can show the Gantt Chart with another task-related view. This is useful when you need timeline context and detailed information together.
You might be wondering: why use a split view? The answer is speed. You can inspect task details without repeatedly changing views.
Add the Task Form
A Task Form can show information such as predecessors, successors, resource assignments, and task type beneath the Gantt Chart.
This layout helps when reviewing dependencies. Select a task in the upper pane, then inspect its relationships in the lower pane.
Use the Details view
The Details view provides more context for the selected activity. Depending on your version, it may show fields connected with scheduling, resources, or task constraints.
For instance, selecting “User acceptance testing” may reveal its predecessors and assigned team members while the chart shows its position in the release plan.
Return to a single-pane view
Split layouts use more screen space and can make the chart feel compressed. To return to a simpler layout, close the lower pane or choose the standard Gantt Chart view again.
Use the single-pane layout for presentations. Use the split layout for detailed schedule maintenance.
Fix Common Display Problems
When the normal steps do not work, check the display settings in a logical order. Start with the view, then inspect filters, panes, zoom, and task visibility.
For example, if the chart shows no bars, first confirm that Gantt Chart is selected. Then clear filters before changing task dates.
Problem: only the task grid appears
Solution: Drag the divider between the grid and timeline toward the left. Maximize the application window if the timeline remains too narrow.
Problem: the chart looks empty
Solution: Clear filters, zoom out, and check whether tasks have valid start and finish dates. Summary activities may also hide detail when collapsed.
Problem: some tasks are missing
Solution: Check whether summary rows are collapsed. Expand the relevant outline level using the controls beside the summary activity.
Problem: bars appear outside the visible area
Solution: Adjust the timescale or use a zoom command that fits the full schedule. Then zoom into the period you need to analyze.
Problem: the chart opens differently each time
Solution: Save the preferred view and layout after making your changes. A saved custom view can reduce repeated setup work.
When Microsoft Project Is Not the Best Display for Your Team
Microsoft Project works well for detailed schedules, especially when you need dependencies, baselines, calendars, and progress tracking. However, teams may struggle when planning information lives across several disconnected places.
A project manager may maintain the schedule in Microsoft Project, while requirements sit elsewhere and meeting decisions remain in chat. That separation makes it harder to understand why a task changed.
A unified workspace can connect project planning with team knowledge. This approach is useful when people need schedules, decisions, requirements, and working guidance in one environment.
Project Planning Solution: ONES.com

Value Proposition
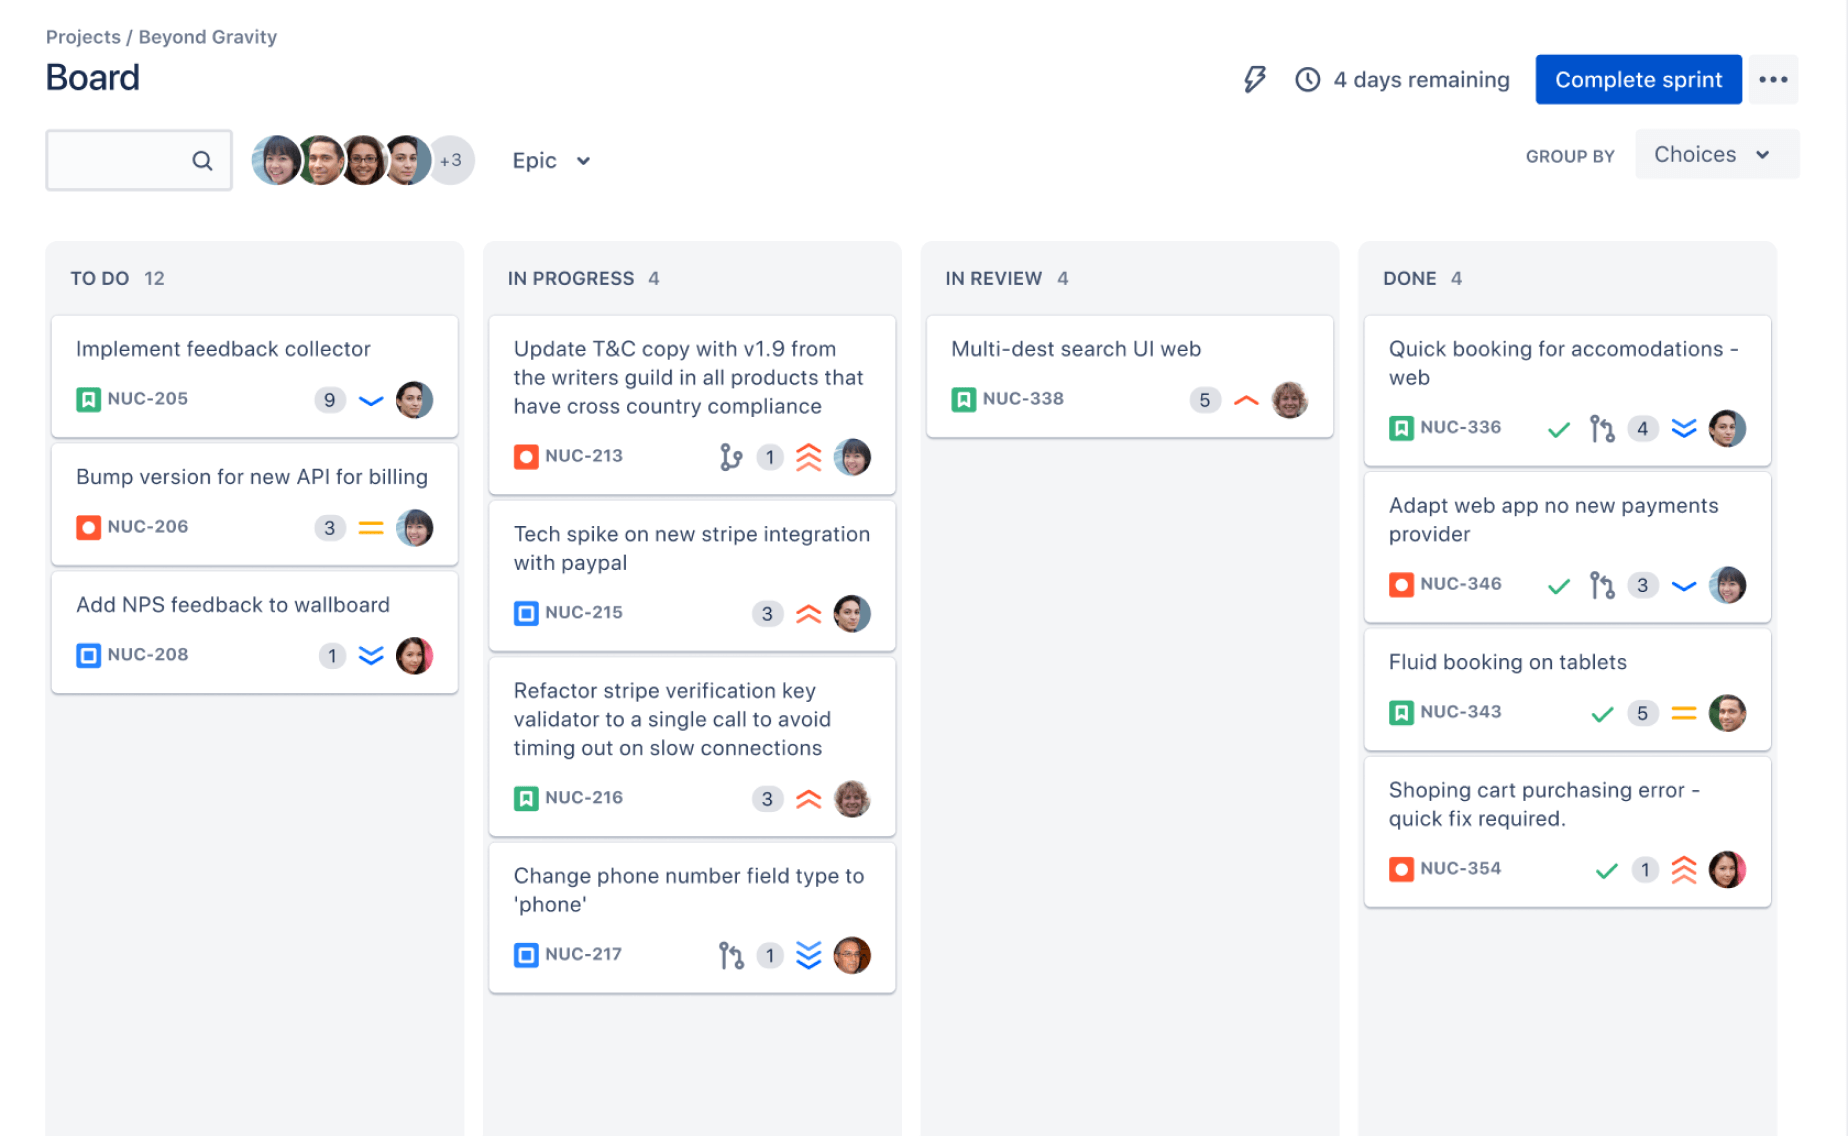
ONES.com combines project management and knowledge management in one platform. It can help teams manage schedules, workflows, requirements, and working guidance without constantly switching between separate systems.
ONES Project is a Jira alternative for project management, while ONES Wiki supports knowledge management as a Confluence alternative. They are sold separately and can be used according to your team’s needs.
Core Capabilities
Scattered planning information → connected project work
Pain: Schedule details, decisions, and requirements may sit in different places.
ONES capability: ONES.com combines project and knowledge management capabilities in one platform.
Result: Your team can connect delivery work with the context needed to complete it.
Complex Jira transition → familiar project workflows
Pain: Teams may hesitate to change systems when existing issue workflows are important.
ONES capability: ONES Project supports Jira-compatible workflows, custom workflows, custom fields, and sprint management.
Result: Teams can preserve familiar planning patterns while evaluating a Jira alternative.
Manual status reporting → built-in reporting
Pain: Preparing status updates can require repeated manual calculations.
ONES capability: Built-in reporting helps teams review progress, workload, and delivery information in a structured way.
Result: Project reviews can focus more on decisions and less on assembling updates.
Disconnected approvals → configurable automation
Pain: Approval steps can become unclear when tasks move through informal channels.
ONES capability: Custom workflows and automation can route work through defined states and actions.
Result: People can see what needs approval, who owns it, and what happens next.
Plugin dependence → native capabilities
Pain: Multiple add-ons can increase administration and create inconsistent experiences.
ONES capability: ONES Project includes native workflow, field, sprint, automation, and reporting capabilities.
Result: Teams may reduce reliance on separate plugins for common project operations.
Restricted deployment requirements → flexible hosting
Pain: Some organizations cannot place project information in a public cloud environment.
ONES capability: ONES.com supports Cloud, On-Premise, Private Cloud, and Air-gapped deployments.
Result: Teams can choose an environment that matches their security and infrastructure requirements.
Different cloud and self-hosted experiences → feature parity
Pain: Self-hosted teams may worry that they will lose important capabilities.
ONES capability: ONES.com provides full feature parity between its cloud and self-hosted versions.
Result: Deployment decisions can focus on operational requirements rather than missing core features.
High entry cost for evaluation → free team access
Pain: A team may need to test a platform before making a broader commitment.
ONES capability: ONES.com offers a free plan for up to 30 seats.
Result: A smaller team can evaluate workflows and collaboration before expanding adoption.
Application scenarios
Software delivery: A product team can manage sprints, defects, requirements, and release milestones in ONES Project while maintaining guidance in ONES Wiki.
Regulated engineering: An engineering organization can use an on-premise or air-gapped deployment when network restrictions affect project operations.
Cross-functional launches: Marketing, design, engineering, and operations can follow custom workflows for approvals, handoffs, and launch readiness.
Common Challenges and Practical Solutions
The chart is visible, but nobody understands it
Problem: A crowded chart may include dozens of columns, unclear task names, and excessive detail.
Solution: Keep only the fields needed for the current review. Group work into clear phases and name milestones around outcomes.
Dates change without clear reasons
Problem: A finish date may move after a predecessor, constraint, or calendar changes.
Solution: Review predecessors, task constraints, calendars, and actual progress before changing dates manually.
The timeline is too detailed for leadership
Problem: Executives usually need major phases, risks, and milestones rather than every small activity.
Solution: Collapse detail rows, zoom to months or quarters, and highlight key delivery points.
Progress updates become unreliable
Problem: Team members may enter percentages inconsistently, making the chart appear more accurate than it is.
Solution: Define a simple update rule. For example, require each owner to report completed work, remaining duration, and blockers.
The team needs context beyond the schedule
Problem: A Gantt Chart shows timing, but it may not explain decisions, requirements, or working instructions.
Solution: Link task planning with a knowledge workspace or use a unified platform such as ONES.com when that fits your operating model.
FAQs
What is the fastest way to show the Gantt Chart in Microsoft Project?
Open the project, select the View tab, and click Gantt Chart. If the timeline still does not appear, drag the divider between the task grid and chart area toward the left. Also check that the application window is maximized and that no filter hides the activities.
Why can I see tasks but not the Gantt bars?
The timeline pane may be too narrow, the chart may be zoomed into an empty period, or a filter may hide relevant tasks. Expand the timeline area, zoom out, and choose All Tasks. Then confirm that visible activities have start and finish dates.
What is the difference between Gantt Chart and Tracking Gantt?
Gantt Chart shows the planned schedule, including task timing and relationships. Tracking Gantt adds progress and baseline comparison. Use the regular view for planning and communication. Use Tracking Gantt when you need to see whether current dates differ from the approved schedule.
How do I show the entire project timeline?
Use the zoom controls or adjust the timescale so the visible period covers the project start and finish. A monthly or quarterly timescale often works well for long projects. After reviewing the complete plan, zoom into weeks or days for detailed coordination.
Can I show task details below the Gantt Chart?
Yes. Microsoft Project supports split layouts such as a Gantt Chart with a Task Form or Details pane. Select a task in the upper area, then review its predecessors, successors, assignments, or scheduling information below. Return to the standard single-pane view when you need more timeline width.
Conclusion
To show the Gantt Chart in Microsoft Project, select View > Gantt Chart. If the chart remains hidden, widen the timeline pane, clear filters, expand collapsed tasks, and adjust the timescale.
A visible chart becomes much more useful when you save a baseline, update progress consistently, highlight critical activities, and choose a timescale that matches your audience.
But here's the truth: the display problem is usually quick to fix. The bigger challenge is keeping schedule details connected with decisions, requirements, and team knowledge.
Microsoft Project remains a practical choice for detailed scheduling. When your team needs broader project and knowledge management, ONES.com offers another structured way to organize delivery work and supporting context.