How to Show the Critical Path in a Gantt Chart: 7 Steps
A Gantt chart can show every task while hiding the work that controls your finish date. That makes delays difficult to spot until they affect a milestone, launch, or customer promise. The problem grows when dependencies change, estimates slip, or several tasks appear equally urgent.
Miss one critical activity, and your entire schedule may move. Teams often react by speeding up visible work, even when another dependency controls the final outcome. You need a clear way to identify and display the longest sequence of dependent tasks.
This guide shows you how to show the critical path in a Gantt chart using seven practical steps. You’ll learn how to calculate it, highlight it, update it, and explain it to your team.
How to Show the Critical Path in a Gantt Chart: 7 Steps
The critical path is the sequence of dependent tasks that determines the shortest possible project duration. To show it, connect task dependencies, calculate schedule flexibility, and highlight tasks with zero total float.
-
List every task and milestone
Start with a complete activity list. Include planning, approvals, design, development, testing, training, launch preparation, and final handover.
Use specific task names. “Prepare checkout test cases” gives your team more clarity than “Testing.” Add milestones such as “Design approved” or “Product released.”
Assign an estimated duration to each activity. Use working days or calendar days consistently throughout the schedule.
-
Estimate realistic durations
Enter the time each task should require under normal working conditions. Avoid using optimistic estimates simply to make the schedule look shorter.
For example, a product review may take two days when one person approves it. It may take five days when three departments must respond.
If a task has uncertain timing, record a reasonable estimate and add a note about the risk. You can revise the duration later when better information becomes available.
-
Connect task dependencies
Link activities according to their actual order. A development task may begin after design approval. Testing may begin after a working build exists.
Most project schedules use four dependency types:
- Finish-to-start: One task must finish before another begins.
- Start-to-start: One task must begin before another can begin.
- Finish-to-finish: Two tasks must finish in a defined relationship.
- Start-to-finish: One task must start before another can finish.
Finish-to-start links are common, but do not use them automatically. If two tasks can run together, model that overlap instead of creating an artificial delay.
-
Set the project start and finish milestones
Choose the project start date and define the final milestone. The final milestone might be a launch, construction handover, regulatory submission, or customer acceptance.
A clear endpoint gives the schedule something to calculate against. Without one, you may see task timing without understanding the date the project must protect.
For example, a website redesign may end with “New site live.” Every activity leading to that milestone should connect to the release path.
-
Calculate the early and late dates
Calculate when each activity can start and finish as early as possible. Then calculate how late each activity can start and finish without delaying the project.
These calculations produce four useful values:
- Early start: The soonest an activity can begin.
- Early finish: The soonest an activity can end.
- Late start: The latest an activity can begin without affecting the final milestone.
- Late finish: The latest an activity can end without extending the project.
Total float is the difference between the early and late dates. Activities with zero total float usually belong to the critical path.
-
Highlight zero-float activities
Apply a distinct color, label, icon, or formatting rule to activities with zero total float. Red is common, but choose a color that remains readable for people with color-vision differences.
Keep noncritical activities visually quieter. A gray or blue treatment can help the critical sequence stand out without hiding important work.
For example, your Gantt chart might show requirements approval, architecture, development, integration testing, and launch in red. Other tasks remain visible but use a neutral color.
-
Check the logic and update it regularly
Review the highlighted path with the people doing the work. Ask whether the links, durations, and constraints reflect reality.
Then update the chart when progress changes. A delay on a task with float may consume that flexibility. After the float reaches zero, the activity may become critical.
Critical path analysis is not a one-time exercise. It is a schedule control method that should change as work progresses.
What the Critical Path Tells You
The critical path identifies the longest connected sequence of dependent activities. It also shows which delays can move the project finish date.
Here’s why:
Suppose a five-day task leads to a three-day task, followed by a two-day task. That chain takes ten working days. If another chain takes only seven days, the ten-day chain controls the earliest finish.
The critical path does not always contain the most expensive, visible, or difficult activities. A short approval step can become critical when every later activity depends on it.
| Term | Meaning |
|---|---|
| Critical activity | An activity with little or no scheduling flexibility. |
| Critical path | The longest dependent sequence controlling the earliest project finish. |
| Total float | The time an activity can slip without delaying the final milestone. |
| Free float | The time an activity can slip without delaying its immediate successor. |
| Near-critical activity | An activity with very little float that could soon affect the finish date. |
A schedule can have more than one critical path. This happens when two separate dependency chains have the same total duration. In that situation, both chains need close attention.
How to Calculate the Path Manually
You can calculate a simple critical path without specialized software. The process works best for small projects with clear relationships and limited branching.
Use a forward pass
Begin with the first activity. Set its early start to day zero, or to the project start date. Add the activity duration to calculate its early finish.
For each successor, use the latest early finish among its predecessors as the successor’s early start. Continue until you reach the final milestone.
Example:
- Define requirements: 3 days
- Design solution: 4 days
- Build feature: 7 days
- Run acceptance testing: 3 days
This chain requires 17 working days when each activity follows the previous one.
Use a backward pass
Start at the final milestone and work backward. Set the final activity’s late finish to its early finish. Subtract its duration to find its late start.
For each predecessor, use the earliest late start among its successors as the predecessor’s late finish. Continue until you reach the first activity.
Calculate float
Subtract early start from late start. You can also subtract early finish from late finish. Both calculations produce total float when the schedule uses consistent dates.
If an activity has zero float, mark it as critical. If it has two days of float, it can slip by two days without moving the project finish.
Compare multiple paths
Do not stop after finding one long chain. Trace every route from the beginning to the final milestone.
For instance, development may take ten days while security review takes eight days. A later change can increase the security review to eleven days, making it the new critical path.
How to Make the Highlight Easy to Read
A correct calculation is useful only when your team can understand it quickly. The chart should answer three questions: what is critical, why is it critical, and what happens if it slips?
Use a visible but accessible style
Use a strong color for critical activities and a calmer color for other work. Add a text label such as “Critical” when the chart is used in presentations or printed reports.
Color alone can create confusion. A red bar may represent risk in one chart and criticality in another. Add an icon, pattern, or legend to make the meaning clear.
Show relationships between activities
Dependency lines should remain visible, especially around the critical sequence. Without them, viewers may see red bars without understanding the chain connecting them.
For a large schedule, filter the view to show critical and near-critical activities first. Then allow people to expand the surrounding work when they need more context.
Display float where it matters
Show total float in a column or tooltip. This helps project managers distinguish between zero-float activities and activities with only one or two days of flexibility.
A near-critical activity deserves attention even when it is not red. If a task has one day of float, a small delay could place it on the critical path.
How to Keep the Critical Path Accurate
Critical path visibility declines when schedules are updated irregularly. A chart created at project kickoff may no longer reflect reality after several changes.
Update actual progress
Record completed work, remaining duration, and revised finish expectations. A task that appears 80 percent complete may still have important testing left.
For example, a two-day review can consume five days if reviewers return questions. Update the remaining duration instead of leaving the original estimate unchanged.
Review dependency changes
Teams often add work without adding relationships. That can hide a new controlling chain.
When someone adds a compliance check, integration step, or approval, connect it to the activities it affects. Then recalculate the schedule.
Watch constraints and deadlines
Hard deadlines can change the way a schedule behaves. A fixed delivery date may create negative float when the calculated finish extends beyond that date.
Negative float signals that the project needs a corrective action. You may need to shorten activities, overlap work, add capacity, or renegotiate the milestone.
Track the critical path during status meetings
Ask three practical questions:
- Which critical activity changed since the last review?
- How much float remains on near-critical activities?
- What decision or resource could protect the next critical milestone?
These questions keep attention on schedule control instead of general activity reporting.
Common Mistakes When Showing Critical Work
Critical path analysis can produce misleading results when the schedule logic is weak. The most common problems come from missing relationships, unrealistic durations, and excessive date constraints.
Missing dependencies
If a task has no predecessor or successor when one should exist, the calculated path may be incomplete. Review every major activity and ask what must happen before it and after it.
Using summary activities as real work
A summary activity groups smaller tasks. It should not replace the detailed relationships between those tasks.
For example, “Launch preparation” may contain training, support planning, and communication. Link those activities properly instead of treating the group as one large task.
Adding too many deadlines
Hard constraints can force dates that do not reflect the actual dependency logic. Use milestones to express important outcomes, but avoid placing fixed dates on every activity.
Ignoring resource limitations
A dependency network may show two activities running at the same time, even though the same specialist must perform both. Resource conflicts can create a practical critical path.
Review the schedule with team leads. If one person owns several concurrent activities, adjust the sequence or assign additional capacity.
Treating every delay as equally dangerous
A one-day delay on a task with ten days of float may have no effect on the finish date. A one-day delay on a zero-float activity may move the entire project.
Use float to prioritize conversations, escalation, and recovery planning.
A Critical-Path Solution: ONES.com

Value Proposition
ONES.com brings project management and knowledge management together, helping teams connect task relationships, schedule reporting, and working guidance in one environment.
ONES Project serves as a Jira alternative with dependency management, sprint planning, automation, custom workflows, custom fields, and built-in reporting.
Core Capabilities
Disconnected scheduling information → Connected project planning
When task relationships sit across separate tools, critical work becomes harder to trace. ONES Project keeps activities, dependencies, owners, and milestones together, giving you a clearer schedule view.
Manual status updates → Built-in reporting
When progress reporting takes repeated manual effort, schedule changes can go unnoticed. Built-in reporting helps your team review progress, workload, and delivery signals more consistently.
Rigid task structures → Custom workflows and fields
Different projects need different approval steps and schedule attributes. Custom workflows and fields let you represent stages such as review, testing, compliance, and release readiness.
Plugin-heavy operations → Native project capabilities
Multiple add-ons can create maintenance work and inconsistent behavior. ONES Project provides native support for sprint management, automation, reporting, and customizable project workflows.
Complex dependency reviews → Clearer schedule analysis
Critical path analysis depends on reliable relationships. Use linked activities and milestones to examine the sequence controlling delivery, then configure reporting views around the risks your team tracks.
Restricted network requirements → Flexible deployment choices
Some organizations cannot place project information in a public cloud environment. ONES.com supports Cloud, On-Premise, Private Cloud, and Air-gapped deployments.
Migration concerns → Jira-compatible workflows
Teams moving from Jira may want familiar working patterns. ONES Project supports Jira-compatible workflows while providing full feature parity between its cloud and self-hosted versions.
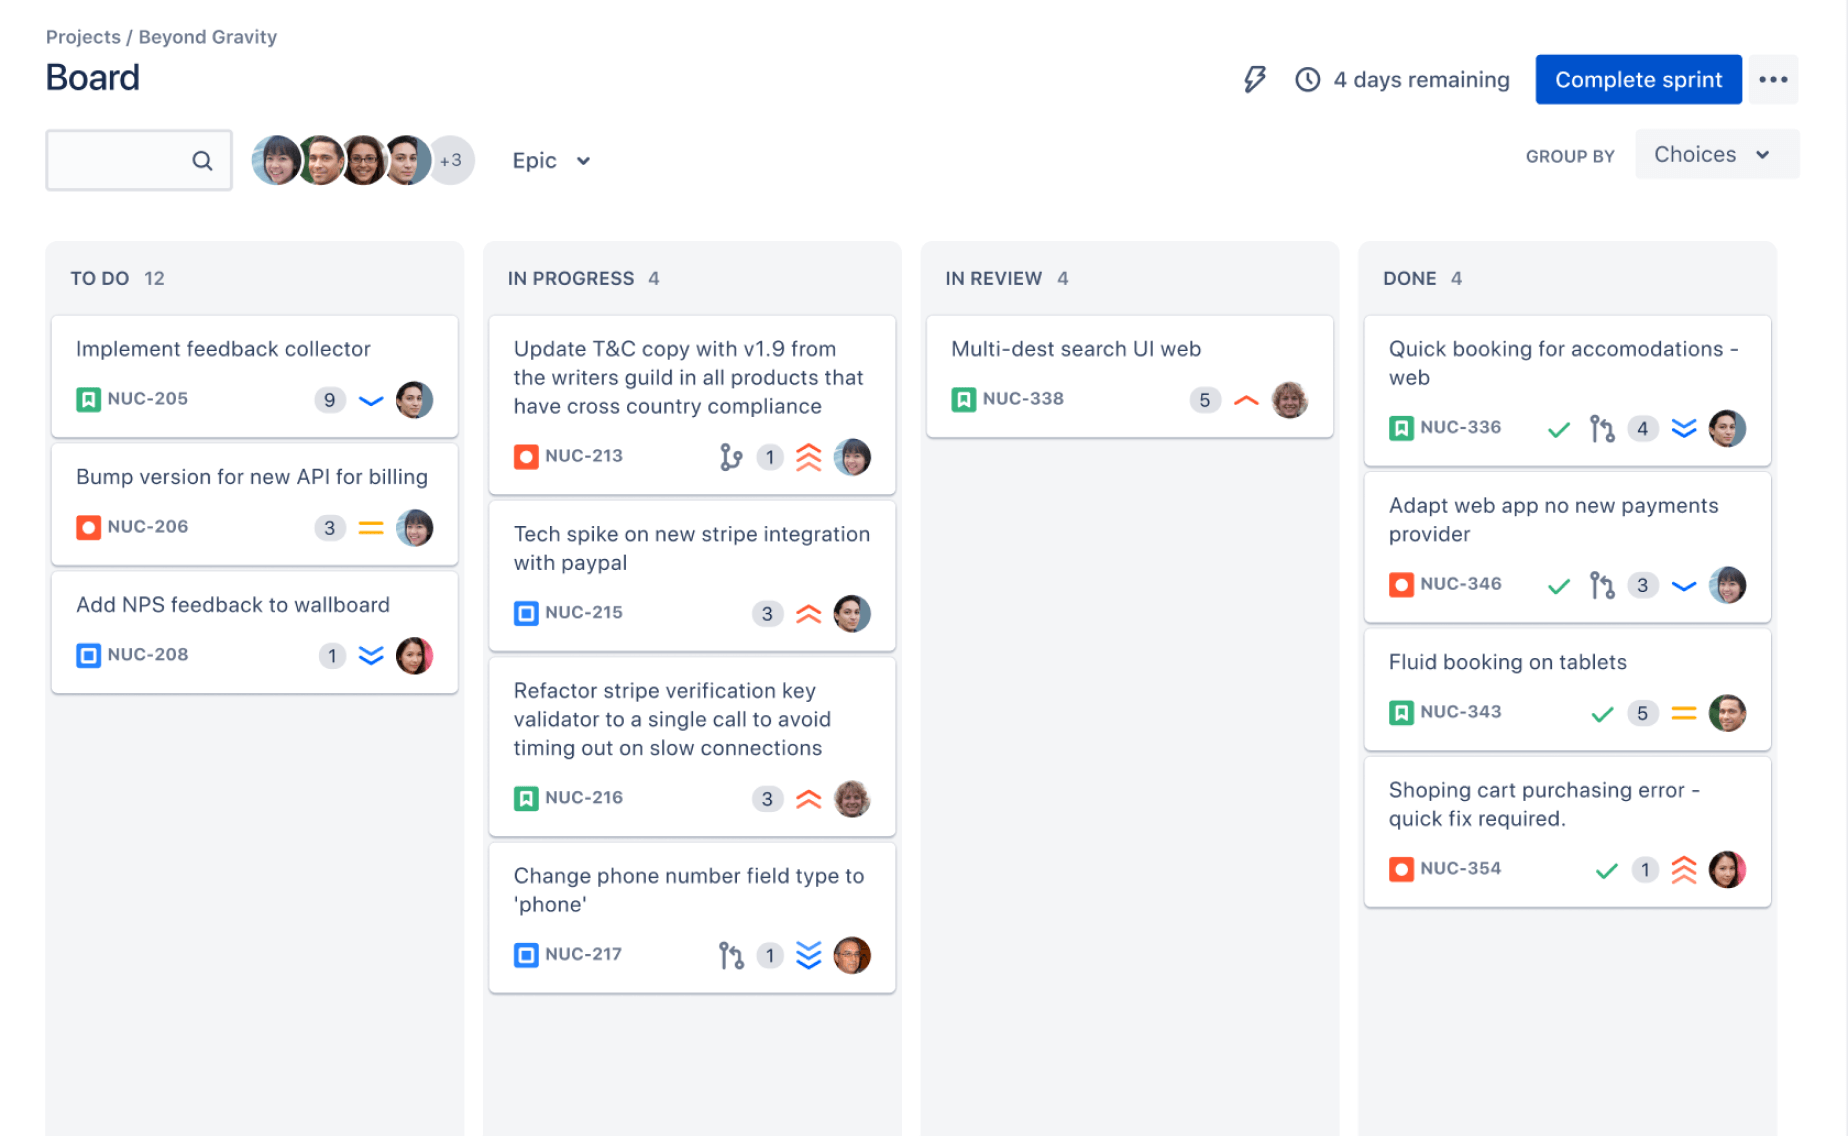
Separate project and knowledge work → Unified workspace
Critical path decisions often need supporting guidance, procedures, and explanations. ONES.com combines ONES Project with ONES Wiki, a knowledge base that can serve as a Confluence alternative.
Application Scenarios
Software release: A product team links requirements, development, integration testing, security review, and release approval. The team reviews critical activities during sprint planning and release meetings.
Regulated implementation: A compliance team tracks approvals, evidence collection, validation, and operational readiness. Air-gapped deployment can support environments with strict network restrictions.
Cross-functional launch: Marketing, product, support, and engineering coordinate around one launch milestone. Custom fields identify owners, risk levels, and approval states while reports show progress.
Common Challenges and Practical Solutions
Challenge: Several activities appear critical
Solution: Check whether the schedule has multiple paths with the same duration. Review each path separately and focus on shared milestones, because a delay on either path may affect delivery.
Challenge: The chart shows no critical path
Solution: Look for missing start or finish relationships, excessive float, incomplete dates, or an undefined final milestone. A valid schedule needs a connected route from project start to project finish.
Challenge: The critical path changes every week
Solution: Frequent changes may reflect genuine progress, weak estimates, or unstable dependencies. Compare the reason for each change and improve the schedule logic instead of hiding the movement.
Challenge: Managers focus only on red activities
Solution: Explain that near-critical activities also matter. A task with one day of float can become critical after a small delay, especially when it supports a major milestone.
Challenge: Teams disagree with the calculated path
Solution: Review the chart with the people performing the work. Confirm durations, approval timing, resource conflicts, and relationships before changing the calculation.
FAQs
What color should I use for the critical path?
Use a strong, consistent color that contrasts with ordinary activities. Red is common, but accessibility matters more than convention. Add a label, icon, or pattern so people do not need color recognition alone. Include a legend explaining the meaning of critical, near-critical, and noncritical activities.
Can a Gantt chart have two critical paths?
Yes. Two or more dependency chains can have the same total duration and zero float. This creates multiple critical paths. Review all of them because a delay on either chain can affect the final milestone. Shared activities deserve special attention because they may connect several critical routes.
Does the critical path always contain the longest individual task?
No. It contains the longest connected sequence of dependent activities. A short task can belong to the critical path when it sits between other controlling activities. A longer standalone task may have substantial float and create no delay when it slips.
How often should I update the critical path?
Update it whenever actual progress, remaining duration, dependencies, resources, or milestones change. Many teams review it weekly, while high-risk projects may need daily updates. The right frequency depends on how quickly schedule conditions change.
What is the difference between critical path and critical chain?
The critical path focuses on activity dependencies and schedule duration. Critical chain also considers resource limitations and protective buffers. If the same specialist must complete two activities that appear concurrent, resource availability may extend the practical delivery sequence.
Can I show the critical path without project management software?
Yes. You can calculate early dates, late dates, and float manually for a small project. However, frequent changes make manual calculations difficult to maintain. A project management platform can recalculate relationships and present updated schedule information more efficiently.
Conclusion
To show the critical path in a Gantt chart, list every activity, estimate durations, connect dependencies, define milestones, calculate float, highlight zero-float work, and update the schedule regularly.
But here’s the truth: the colored bars are only useful when the underlying logic reflects real work. Validate the chart with your team, watch near-critical activities, and respond quickly when float disappears.
When delays, changing dependencies, and disconnected planning make that difficult, a platform such as ONES.com can help you organize project relationships, reporting, workflows, and supporting knowledge in one workspace.