How to Print an Entire Gantt Chart on One Page: 7 Steps
Printing a full Gantt chart on one page sounds simple until task names become tiny, dates disappear, and half the timeline spills onto another sheet. A chart that looks clear on your screen can become unreadable when printed.
The problem usually comes from too much timeline detail, a wide date range, or page settings that ignore the chart’s natural proportions. Keep changing random margins, and you may create a cramped page without fixing the real issue.
But here's the truth: you can usually fit an entire Gantt chart onto one page with a few deliberate adjustments. The steps below show you how to choose the right page layout, scale the timeline, remove unnecessary detail, preview the result, and preserve enough clarity for practical use.
How to Print an Entire Gantt Chart on One Page
To print an entire Gantt chart on one page, set the page to landscape orientation, choose a larger paper size when available, scale the chart to one page wide and one page tall, then preview and adjust the timeline detail.
Follow these seven steps in order. The exact menu names may differ between project management tools, but the process remains similar.
-
Open the print or page setup controls
Start by opening the Gantt chart’s print settings rather than printing immediately. Look for commands such as Print, Page Setup, Print Preview, or Export.
These controls usually let you change orientation, paper size, margins, scaling, headers, footers, and the visible date range. You need access to most of these options before making adjustments.
-
Change the page orientation to landscape
Choose Landscape orientation when your chart runs horizontally across time. Landscape gives the timeline more width, which is usually the most valuable space on a Gantt chart.
Portrait orientation can work for a short project with only a few tasks. For a chart covering several weeks or months, landscape usually reduces excessive shrinking.
-
Choose the largest practical paper size
Select a larger paper size if your printer supports it. For example, switching from Letter to Legal or from A4 to A3 gives the timeline more room without changing the project itself.
Use the largest size that your audience can print, handle, and review easily. A large page that nobody can print is less useful than a smaller page with sensible detail.
-
Set scaling to one page wide and one page tall
Find the scaling controls and choose an option such as Fit to 1 page wide by 1 page tall. This tells the print engine to compress the chart horizontally and vertically.
Some tools show separate settings for width and height. Set both values to one when you need the entire chart on a single page.
If the chart becomes too small, continue with the next steps before increasing the scale. Removing unnecessary visual detail often improves readability more effectively than changing the scale alone.
-
Limit the visible timeline
Review the date range before printing. If your project runs for six months but the current plan only needs the next four weeks, narrow the visible period.
You can often change the start and end dates, time units, or zoom level. Showing weeks instead of individual days may make a long project easier to read while preserving the overall schedule.
For example, a product launch chart might show monthly milestones for the full project and weekly detail only for the current phase.
-
Reduce unnecessary chart elements
Hide or remove elements that do not help the reader understand the schedule. Possible candidates include empty columns, excessive gridlines, unused legends, large titles, and repeated labels.
Keep essential information such as task names, milestones, dependencies, owners, and the time scale. The goal is to reduce clutter while preserving decisions the reader needs to make.
You can also shorten long task names. “Prepare final marketing campaign approval materials” may fit better as “Prepare campaign approval materials.”
-
Preview, inspect, and print
Open print preview before sending the chart to the printer. Check every edge, label, milestone, and date marker.
Look for clipped task names, unreadable text, missing timeline segments, and excessive white space. If the chart looks cramped, adjust one setting at a time and preview again.
When the preview is readable, print one test page. A physical page can reveal faint lines, small text, or color issues that are easy to miss on screen.
Why Gantt Charts Become Difficult to Print
A Gantt chart combines two wide areas: the task list and the timeline. As the project grows, both areas compete for the same page width.
For example, a chart with 40 tasks and a six-month timeline has far more visual content than a chart with 10 tasks and a three-week timeline. Scaling treats both charts as shapes that must fit, even though their readability needs differ.
Here's why: printing software often follows page boundaries rather than the meaning of your schedule. It may split a timeline after a particular date or shrink every element equally.
That is why a chart can look well organized in an application and awkward on paper. The print layout needs its own review, especially when the chart includes dependencies, milestones, or multiple work streams.
How to Keep the Printed Chart Readable
Fitting everything on one page is only useful when someone can still understand the schedule. Start by deciding what the reader must see within a few seconds.
A project sponsor may need milestones, delivery dates, and major phases. A project team may need task names, dependencies, and weekly timing. These audiences may require different print views.
The best part? You can often create a clean overview without deleting important planning information. Use broader time units for the full project and reserve detailed daily views for shorter planning periods.
Shorten task labels carefully
Short labels reduce the width of the task area. Keep the meaning clear, and avoid abbreviations that only one person understands.
For example, change “Review and approve updated customer onboarding workflow” to “Approve onboarding workflow.” The shorter label still communicates the action and subject.

Use visual hierarchy
Make summary tasks, milestones, and major phases visually distinct. A reader should recognize the project structure without studying every bar.
Muted colors for routine tasks and stronger colors for milestones can improve scanning. Check the result in grayscale if people may print without color.
Choose practical text size
Print preview gives you a quick test, but a physical page gives you a better answer. If someone must zoom in or hold the page unusually close, the chart needs less content or a larger page.
When the project is too large for readable single-page printing, create an overview page and a detailed schedule page. That approach may serve the audience better than forcing every detail onto one sheet.
Which Print Settings Matter Most?
Several settings affect the result, but orientation, scaling, paper size, margins, and time range usually have the greatest impact.
| Setting | Best starting choice | Why it matters |
|---|---|---|
| Orientation | Landscape | Creates more horizontal room for the timeline. |
| Scaling | One page wide and one page tall | Keeps the chart on one printed page. |
| Paper size | Largest practical option | Allows larger text and wider timeline spacing. |
| Margins | Narrow or moderate | Returns unused space to the chart area. |
| Time range | Only the period readers need | Prevents distant dates from shrinking the entire chart. |
| Time unit | Weeks or months for broad plans | Reduces unnecessary date labels and gridlines. |
Let me explain: scaling alone cannot solve every layout problem. If the chart covers too many months, the software must compress those months regardless of your margin settings.
Change the time range and time unit before reducing the text size. A simpler timeline often produces a larger, clearer chart with more useful information.
When One-Page Printing Works Best
A one-page Gantt chart works well for executive reviews, kickoff meetings, status updates, and project wall displays. These situations usually need a high-level view rather than every daily activity.
For example, a construction manager might print one page showing design, permits, procurement, construction, inspections, and handover. Each phase can contain summary bars and key milestones.
A one-page layout becomes less effective when the schedule contains hundreds of tasks, several simultaneous work streams, or highly detailed dependencies. In that situation, create a summary view for communication and a detailed view for execution.
You might be wondering: does fitting a chart onto one page remove detail? It can, if you rely on automatic scaling alone. With a carefully chosen date range and clear hierarchy, you can preserve the information that matters most.
Common Mistakes That Make the Chart Unreadable
Many poor printouts come from a small number of repeatable mistakes. Recognizing them makes troubleshooting faster.
Keeping portrait orientation
Portrait pages provide limited horizontal space. The timeline becomes narrow, and labels may wrap or disappear.
Printing the entire project history
Old completed phases and distant future work can force the current plan into a tiny area. Show the period relevant to the meeting or decision.
Leaving every column visible
Extra columns for status, estimates, owners, and notes can consume the space needed by task names and dates. Keep only the fields that support the printout’s purpose.
Using color without checking contrast
Light colors may disappear on a basic printer. Strong contrast, distinct patterns, or clear labels can make the schedule easier to interpret.
Skipping the physical test page
Print preview is useful, but it cannot show every paper-related issue. Test the page before distributing it to a meeting or posting it publicly.
Printing and Sharing Gantt Charts with ONES.com
ONES.com brings project management and knowledge management together, with ONES Project for scheduling and ONES Wiki for organized team knowledge. You can use ONES Project to create Gantt views, manage timelines, and prepare a clearer project overview for printing or sharing.

The platform is available through Cloud, On-Premise, Private Cloud, and Air-gapped deployments. ONES Project is sold separately, and it works as a Jira alternative for teams that need structured project workflows with fewer add-ons.
Complex schedules are difficult to prepare for printing
ONES capability: ONES Project supports custom workflows, custom fields, sprint management, and Gantt-style scheduling views.
Result: You can organize project information before adjusting the page layout, making the printed overview easier to understand.
Manual status tracking creates outdated charts
ONES capability: Built-in reporting and project tracking help connect schedule progress with ongoing work.
Result: Your printout can reflect a more current project state instead of requiring repeated manual updates before each review.
Multiple plugins create inconsistent project views
ONES capability: Native project workflows, reporting, fields, and automation reduce reliance on separate extensions.
Result: The chart and related project information can follow a more consistent structure across teams.
Restricted networks limit deployment choices
ONES capability: ONES.com supports self-hosted deployment, including On-Premise, Private Cloud, and Air-gapped environments.
Result: Teams with strict infrastructure requirements can manage project schedules in an environment that fits their operational controls.
Different teams need different schedule views
ONES capability: Custom fields, workflows, and reporting allow teams to organize information around their own planning needs.
Result: You can prepare a high-level page for leadership while keeping more detailed working views for project contributors.
Large teams need a practical starting point
ONES capability: The free plan supports up to 30 seats, giving a small team room to test core project workflows.
Result: You can evaluate whether the platform fits your planning and reporting process before expanding adoption.
Jira workflows may require a familiar transition
ONES capability: ONES Project supports Jira-compatible workflows while adding native reporting, automation, sprint management, and custom project controls.
Result: Teams exploring a Jira alternative can preserve familiar working patterns while reducing dependence on multiple plugins.
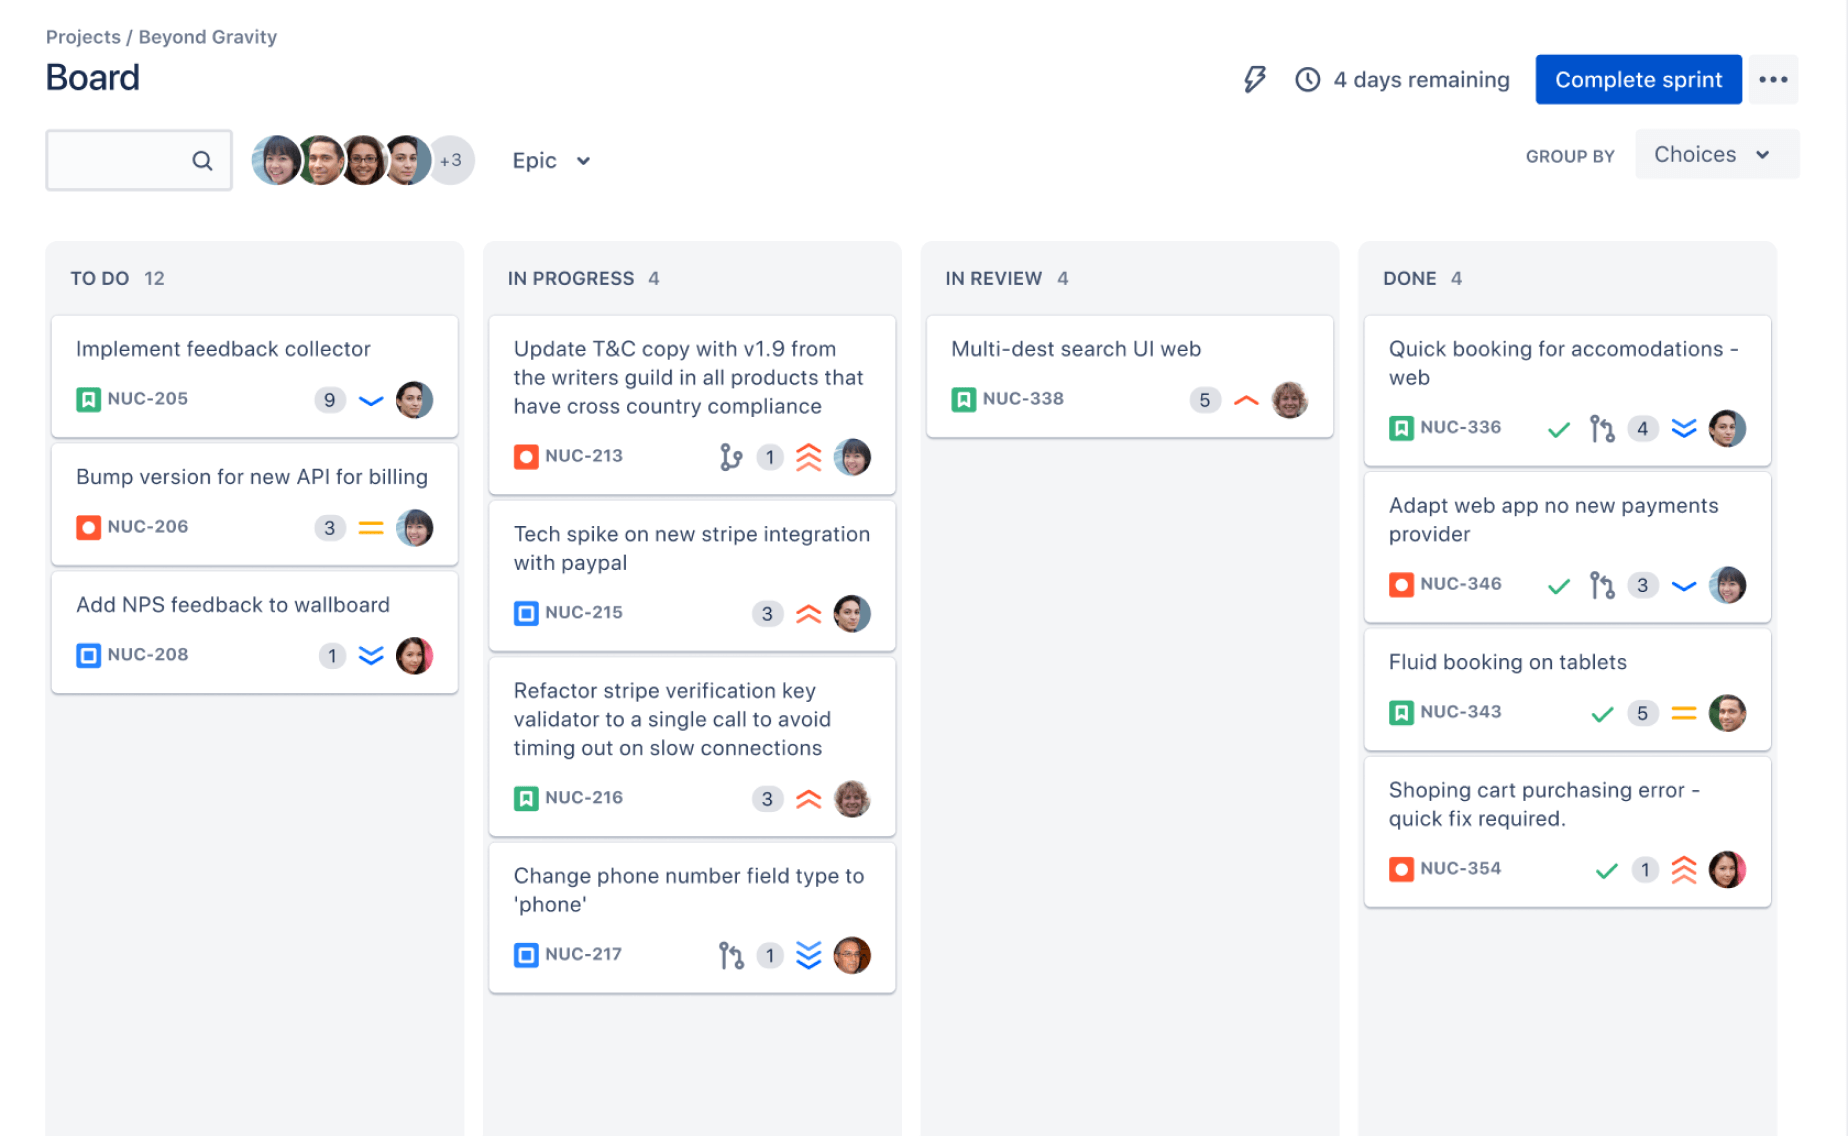
Project knowledge can become separated from schedule work
ONES capability: ONES.com combines project management with knowledge management through ONES Wiki, which is sold separately.
Result: Teams can connect planning conversations, procedures, and project context more easily when preparing reviews and status updates.
Application scenario: executive project reviews
A program manager can create a summary Gantt view with major phases, milestones, and current dates. After setting landscape orientation and one-page scaling, the chart can support a concise leadership review.
Application scenario: restricted-network project planning
An engineering team working in an air-gapped environment can use a self-hosted deployment for project planning. The team can prepare schedule views without moving project information into an external environment.
Application scenario: sprint and release planning
A software team can combine sprint management with broader release milestones. A one-page overview can show the release path, while detailed sprint work remains available for daily execution.
Common Challenges and Practical Solutions
The chart fits, but the text is too small
Problem: Automatic scaling forces every task and date label into a tiny area.
Solution: Reduce the visible date range, use broader time units, hide low-value columns, or choose a larger paper size. Preserve readability before insisting on one page.
The timeline fits, but task names are clipped
Problem: The task list uses too much or too little width, causing labels to disappear.
Solution: Shorten labels, adjust the task-list width, and remove columns that do not support the purpose of the printout.
The chart prints across multiple pages
Problem: The print engine ignores the desired page count or applies separate horizontal and vertical scaling.
Solution: Open the page setup controls and set both width and height to one page. Confirm the result in preview before printing.
Milestones are hard to see
Problem: Milestone symbols blend into bars, gridlines, or light colors.
Solution: Use stronger contrast, clearer milestone labels, and a time scale that leaves enough room around important dates.
The printed chart becomes outdated quickly
Problem: Schedule changes make a paper copy inaccurate soon after printing.
Solution: Add a print date, show the current status clearly, and print shortly before the meeting. Keep the live project view available for later changes.
FAQs
Can I print a Gantt chart on one page without changing the project schedule?
Yes. Printing settings usually change only the visual layout, not task dates or dependencies. Set landscape orientation, choose one page wide and one page tall, and adjust the paper size or margins. You may still need to reduce the visible date range or hide extra columns if the chart becomes too small.
Why does my Gantt chart print on several pages?
The chart may exceed the printable width or height, or the print settings may use automatic page breaks. Open page setup and select a fit-to-page option. Check whether width and height are configured separately. If both dimensions are set to one page, preview the result and adjust the timeline detail.
Should I use landscape or portrait orientation?
Landscape is usually better because Gantt charts extend horizontally across time. Portrait can work for short schedules with few tasks and a narrow date range. If your chart includes several weeks or months, landscape gives the timeline more room and generally reduces extreme shrinking.
How can I print a large project plan clearly?
Create a summary view that shows major phases, milestones, and important dates. Use weeks or months instead of daily labels when the project spans a long period. Remove columns that do not support the review. Keep a detailed working view separately for people who need individual tasks and dependencies.
Will printing in color make the chart easier to read?
Color can help distinguish phases, teams, or milestones, but it should not carry the entire meaning. Use strong contrast and clear labels so the chart remains understandable in grayscale. Always check print preview and, when possible, test one physical page before distributing the chart.
Conclusion
Printing an entire Gantt chart on one page requires more than pressing Print. Set landscape orientation, choose a suitable paper size, fit the chart to one page wide and tall, narrow the timeline, remove clutter, and inspect the result before distribution.
But here's the truth: a one-page chart succeeds when it communicates the right information clearly. If automatic scaling makes the schedule unreadable, create a focused overview instead of forcing every detail into the same space.
For structured planning, reporting, and flexible deployment, ONES Project can help you prepare clearer schedule views within ONES.com. Start with the page purpose, then adjust the chart around what your readers need to understand.