How to Make a Gantt Chart on monday.com: 7 Easy Steps Today
Project dates can drift quickly when tasks live in separate views. A missed handoff may push three dependent activities, while stakeholders still see the original deadline. That makes progress harder to understand and creates awkward status meetings.
The problem grows when your plan includes overlapping work, approval stages, or several people sharing one milestone. A simple task list may show what needs doing, yet it rarely reveals how one delay affects the whole schedule.
Here’s the practical solution: build a Gantt chart directly on a monday.com board. You can add dates, connect dependencies, display work on a timeline, and spot schedule risks visually. Follow these seven steps, then fine-tune the view for your team.
How to Make a Gantt Chart on monday.com in 7 Steps
A monday.com Gantt chart turns board tasks into a visual project schedule. It uses date or timeline information to show task duration, overlapping work, milestones, and dependencies in one view.
You can create one by setting up a project board, adding schedule columns, entering task dates, enabling dependencies, and adding a Gantt view. Here’s why: the chart becomes useful only when your task data reflects the real workflow.
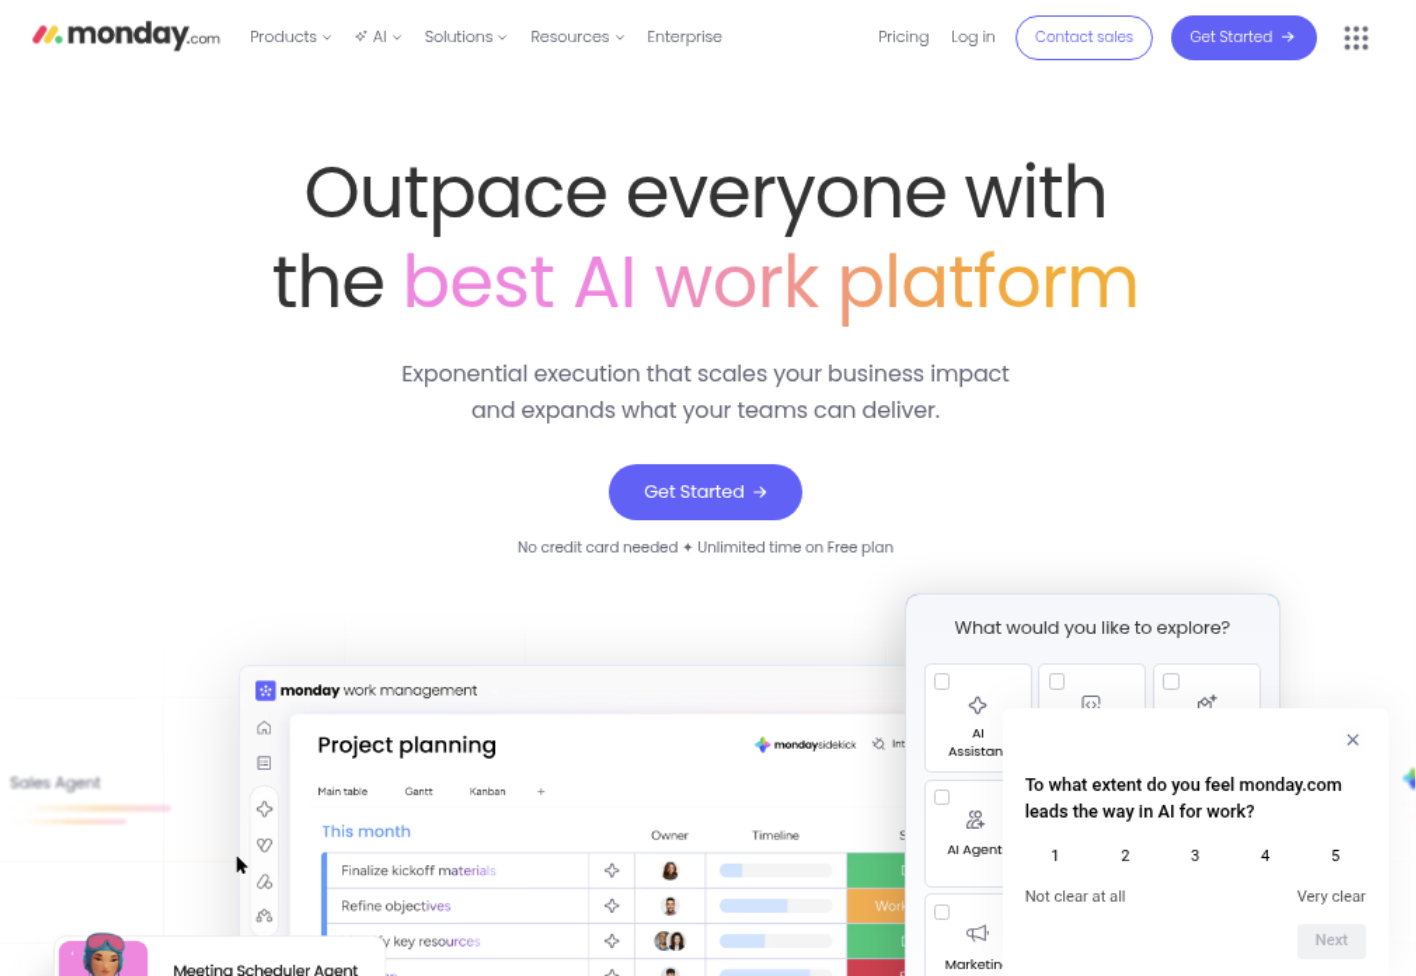
1. Create a Project Board
Start with a new monday.com board or choose an existing board that contains the project work. Give the board a specific name, such as “Website Launch” or “Office Relocation.”
Use one item for each meaningful activity. For example, a website launch might include “Approve homepage copy,” “Build landing page,” and “Complete quality review.”
Avoid making every tiny action its own item. Ten-minute actions can make the chart crowded and difficult to read. Group small actions under a larger deliverable when they share the same deadline.
2. Add the Columns You Need
Make sure the board includes columns that describe ownership, timing, and progress. A practical starting setup includes:
- Item name: the task or deliverable.
- People: the person responsible for the work.
- Status: the current stage, such as Planning, Working, Review, or Done.
- Date or Timeline: the planned start and finish dates.
- Dependency: the relationship between tasks.
- Priority: the urgency or business importance.
You may also add a group column, tags, budget information, or a risk indicator. Keep the first version focused. Extra fields help only when they support planning or decision-making.
Example: “Design checkout page” may have a timeline from April 8 to April 12. “Approve checkout page” may run from April 15 to April 16.
3. Enter Start and Finish Dates
Add a start date and an end date for every task that belongs on the schedule. Use a Timeline column when work lasts across multiple days.
If your plan contains single-day activities, a Date column may be enough. A Timeline column works better for tasks such as research, development, testing, or vendor coordination.
Use realistic durations. If a review usually takes two business days, allow two days instead of assigning a single afternoon. A Gantt chart is only as reliable as the time estimates behind it.
Here’s a useful check: compare each task duration with your team’s normal working rhythm. A task planned for Friday may need a longer window if approval rarely happens during weekends.
4. Connect Related Tasks with Dependencies
Dependencies show which tasks rely on other tasks. For example, development may begin after design approval, and testing may begin after development ends.
Add the dependency column if it is not already available. Then connect each task to the work that must happen before it. The exact menu names may vary by monday.com plan or workspace setup.
A common sequence looks like this:
- Write the product requirements.
- Approve the product requirements.
- Create the interface design.
- Build the feature.
- Test the feature.
- Release the feature.
When an earlier activity moves, connected tasks can reflect the change more clearly. This helps you examine the schedule before a small delay becomes a launch problem.
5. Add the Gantt View
Open the board’s view options and add a Gantt view. Choose the date or timeline column that should control the chart.
The view will display your items across a calendar scale. Each task appears as a horizontal bar, making duration and overlap easier to understand.
If the chart looks empty, check three things:
- Tasks have dates or timeline values.
- The selected date column contains the schedule.
- Your view filters are not hiding the relevant items.
The best part? You can keep the board as the working area while using the Gantt view for planning, review, and schedule conversations.
6. Configure the Chart for Readability
Adjust the chart so it answers practical questions quickly. You may be able to change the time scale, group tasks, show milestones, apply filters, or select colors linked to status.
Use grouping to separate major workstreams. A product launch might include Marketing, Engineering, Legal, and Customer Support groups.
Use colors with purpose. For example, green can show completed work, yellow can highlight items at risk, and red can identify overdue tasks. Keep the color scheme consistent across project reviews.
Apply filters when presenting a specific view. A manager may need milestones and risks, while an engineer may need assigned tasks and dependencies.
7. Review, Share, and Maintain the Schedule
Review the complete chart with the people doing the work. Ask whether the dates, task order, ownership, and dependencies reflect reality.
Then share the view with stakeholders through the available monday.com permissions or dashboard options. Explain how often the schedule will be updated and who owns changes.
Schedule a recurring review. During each review, check:
- Tasks that passed their planned finish date.
- Dependencies affected by a delay.
- Upcoming milestones within the next two weeks.
- Work assigned to someone with limited capacity.
- Tasks marked complete without a confirmed handoff.
A Gantt chart works best as a living planning view. Update it when scope, staffing, approvals, or delivery dates change.
What a Gantt Chart Shows on a monday.com Board
A Gantt chart gives you a time-based view of board items. Each bar shows when a task starts and ends, while the position of each bar reveals sequencing and overlap.
For example, content planning may run from May 1 to May 5. Design may run from May 6 to May 10. Development may overlap with final design on May 9, if the team can work with approved sections.
Milestones appear as important points rather than long activities. A “Launch approved” milestone may sit after testing and before release preparation.
Let me explain the main visual signals:
- Long bars: activities that consume more calendar time.
- Overlapping bars: work happening during the same period.
- Gaps: waiting time, missing planning, or a deliberate buffer.
- Dependency links: relationships between tasks.
- Late items: work that may threaten a later milestone.
This view helps you discuss schedule logic with concrete examples. Instead of saying “the project feels delayed,” you can point to the approval task blocking development.
How to Build a More Accurate Project Timeline
The fastest way to improve a Gantt chart is to improve the planning decisions behind it. Start with outcomes, then break each outcome into activities that can be owned and measured.
Separate Deliverables from Activities
A deliverable is the result your team must produce. An activity is the work required to produce it.
For a new product page, “Product page ready for launch” is a deliverable. “Write copy,” “Create layout,” “Add tracking,” and “Complete review” are activities.
This distinction prevents vague items such as “Work on website.” Specific activities create clearer dates and more useful dependencies.
Use Buffers Where Uncertainty Exists
Some work has predictable timing. Other work depends on approvals, external replies, technical investigation, or legal review.
Add a reasonable buffer around uncertain work. If a supplier usually responds within three business days, avoid planning the next task for the same afternoon.
A buffer does not excuse weak planning. It gives the schedule room to handle normal variation without moving every later activity.
Set Milestones Around Decisions
Milestones should represent meaningful decisions or outcomes. Examples include “Scope approved,” “Prototype accepted,” “Testing complete,” and “Launch ready.”
Place milestones where they help you judge progress. A milestone at the end of every small task adds clutter and makes important decisions harder to notice.
Common Mistakes When Creating a Gantt Chart
Even a well-designed view can become confusing when planning habits work against it. These mistakes appear often in marketing campaigns, software projects, and operational work.
Adding Dates Without Ownership
A task with a deadline but no accountable person can remain untouched until the deadline becomes urgent. Assign a clear owner before you finalize the schedule.
Several contributors may help with one activity, yet one person should coordinate completion and communicate risks.
Creating Dependencies for Every Task
Dependencies should represent real constraints. Linking every item to another item creates a rigid schedule that may be difficult to maintain.
Connect tasks when sequence matters. For example, testing depends on a build being available. A weekly team meeting may not need a dependency link.
Ignoring Capacity
A chart can show five tasks happening at once, but one person may own all five. That creates a capacity problem even when the timeline looks attractive.
Review assignments alongside dates. If one designer owns three urgent deliverables in the same week, move dates, adjust scope, or add support.
Leaving Completed Work Unclear
Marking a task complete should mean the agreed result is ready. If the work still needs approval, use a separate review status or a follow-up item.
This distinction protects the schedule from false progress. A task that appears complete while waiting for approval may still block the next activity.
Gantt Chart Alternatives for Different Planning Needs
A Gantt chart is useful when timing and sequence matter. It may not be the best primary view for every kind of work.
| Planning need | Useful view |
|---|---|
| Track work across dates | Gantt or Timeline view |
| Manage tasks by workflow stage | Kanban-style board view |
| Review deadlines by month | Calendar view |
| Monitor several projects | Dashboard or portfolio view |
| Review personal assignments | My Work or filtered task view |
You can combine these views instead of choosing only one. Use the board for daily updates, the Gantt chart for schedule planning, and a dashboard for high-level reporting.
You might be wondering: when should you skip a Gantt chart? A short task list with no meaningful sequence may need only a board view. The chart earns its place when timing, overlap, or dependencies affect delivery.
Natural Project Planning Solution: ONES.com

Value Proposition
ONES.com combines project management and knowledge management on one platform, with AI support through ONES Assistant. ONES Project is a Jira alternative for teams that need structured planning, custom workflows, reporting, and flexible deployment.
ONES Project and ONES Wiki are sold separately. Teams can choose the project management or knowledge management capability that matches their operational needs.
Core Capabilities
- Schedule information spread across separate tools → ONES Project’s unified project workspace → tasks, timelines, ownership, and progress stay easier to coordinate.
- Rigid workflows that fail to match real approval stages → Custom workflows and fields → teams can represent planning, review, approval, and release steps more accurately.
- Limited visibility into delivery health → Built-in reporting → managers can review progress, risks, workload, and trends without assembling separate reports.
- Complex sprint planning → Sprint management → development teams can organize iterations, assign work, and review sprint progress in a structured cycle.
- Repetitive project administration → Automation → routine actions can follow defined triggers, reducing manual status changes and handoffs.
- Jira workflows that teams want to preserve → Jira-compatible workflows → teams can carry familiar planning patterns into a Jira alternative.
- Too many plugins for everyday project needs → Native feature parity → core planning and reporting functions can live within the platform, reducing tool sprawl.
- Hosting or network restrictions → Cloud, On-Premise, Private Cloud, and Air-gapped deployments → teams can select an environment that fits operational and security requirements.
- Concern about access cost during early adoption → Free plan for up to 30 seats → smaller teams can begin evaluating the platform with a defined seat allowance.
Application Scenarios
Software delivery: A product team can plan sprints, connect development tasks to testing, and review release readiness through reports. Custom fields can identify severity, component, or approval status.
Restricted-network operations: A team working in an air-gapped environment can use a self-hosted deployment while maintaining the same core feature parity available in the cloud version.
Cross-functional launches: Marketing, product, and support teams can coordinate launch activities through shared workflows. ONES Wiki can support knowledge management when the team also needs a connected knowledge base.
Common Challenges and Practical Solutions
Challenge: The Chart Becomes Too Crowded
Solution: Reduce the number of low-value items shown in the main view. Group minor actions under deliverables, then filter the chart by workstream, owner, or milestone.
Challenge: Dates Keep Moving
Solution: Identify the reason for each change. Scope growth, late approval, limited capacity, and unclear requirements need different responses. Add a risk indicator so repeated movement becomes visible.
Challenge: Dependencies Do Not Match Reality
Solution: Review links with the people performing the work. Ask, “Could this task begin before the earlier task finishes?” If yes, remove the unnecessary restriction.
Challenge: Stakeholders Misread Progress
Solution: Define what each status means. “In review” should have a clear owner and expected decision date. A shared status language prevents optimistic updates from hiding unfinished work.
Challenge: The Chart Stops Reflecting the Project
Solution: Assign schedule maintenance to a specific person. Review dates during a weekly planning session and update the chart immediately after major decisions.
FAQs
Can I create a Gantt chart without a Timeline column?
You may be able to use a Date column for single-day tasks or a date range, depending on the monday.com setup and plan. A Timeline column is usually more convenient for work spanning several days. If the chart does not display correctly, check which date field the Gantt view uses and confirm that each relevant item contains schedule information.
How many tasks should a monday.com Gantt chart include?
Include enough tasks to explain delivery, dependencies, and major handoffs. A small project may need 15 items, while a complex launch may need several groups. Hide minor actions from the main view when they make the chart difficult to scan. You can retain detailed work on the board while displaying a cleaner schedule for review.
Can I show milestones in the chart?
Yes, you can represent important dates as milestones when the board and view configuration support them. Use milestones for decisions or outcomes, such as approval received, testing complete, or launch day. Avoid turning every task into a milestone. Too many markers reduce the visual importance of major project events.
What should I do if a task is delayed?
Update the task status and finish date, then inspect its connected activities. Ask whether the delay affects a milestone, another team, or a promised delivery date. You may need to move dependent tasks, add capacity, reduce scope, or change the sequence. Record the reason for significant changes so the next planning review has useful context.
Can I use a Gantt chart for several projects?
You can use connected boards, dashboards, or portfolio-style views to review multiple projects, depending on your monday.com plan and workspace design. Keep each project’s detailed schedule manageable, then create a higher-level view containing major milestones, owners, and health indicators. This gives leadership a concise view without forcing every task into one chart.
Conclusion
To create a Gantt chart on monday.com, build a focused project board, add reliable dates, connect real dependencies, create the Gantt view, and review the schedule regularly.
Start with the seven steps today. Then improve the chart with clear ownership, realistic buffers, meaningful milestones, and filters that match each planning conversation.
The problem is usually not the visual chart itself. It is unclear work, weak handoffs, or dates that never receive maintenance. Once your board reflects the actual workflow, the Gantt view can expose delays early and make project decisions easier.