How to Make a Gantt Chart in Google Docs: 7 Simple Steps
Creating a Gantt chart in Google Docs can feel harder than planning the project itself. The table tools are useful, but they do not include a native timeline builder, automatic scheduling, or dependency tracking. As a result, a simple mistake in one date can force you to recolor several rows by hand.
That becomes frustrating when your project has overlapping tasks, changing deadlines, or several people sharing updates. A chart that looks clear today can become confusing tomorrow.
But here's the truth: you can still build a practical Gantt chart in Google Docs with a table, careful labels, and colored timeline cells. Follow these seven steps, and you will have a readable project schedule without needing advanced software.
How to Make a Gantt Chart in Google Docs
A Gantt chart in Google Docs is a table that lists project tasks on the left and uses colored cells to show when each task starts, continues, and ends.
Google Docs does not offer a dedicated Gantt chart feature. You create the visual timeline manually by combining a task table with calendar periods such as days, weeks, or months.
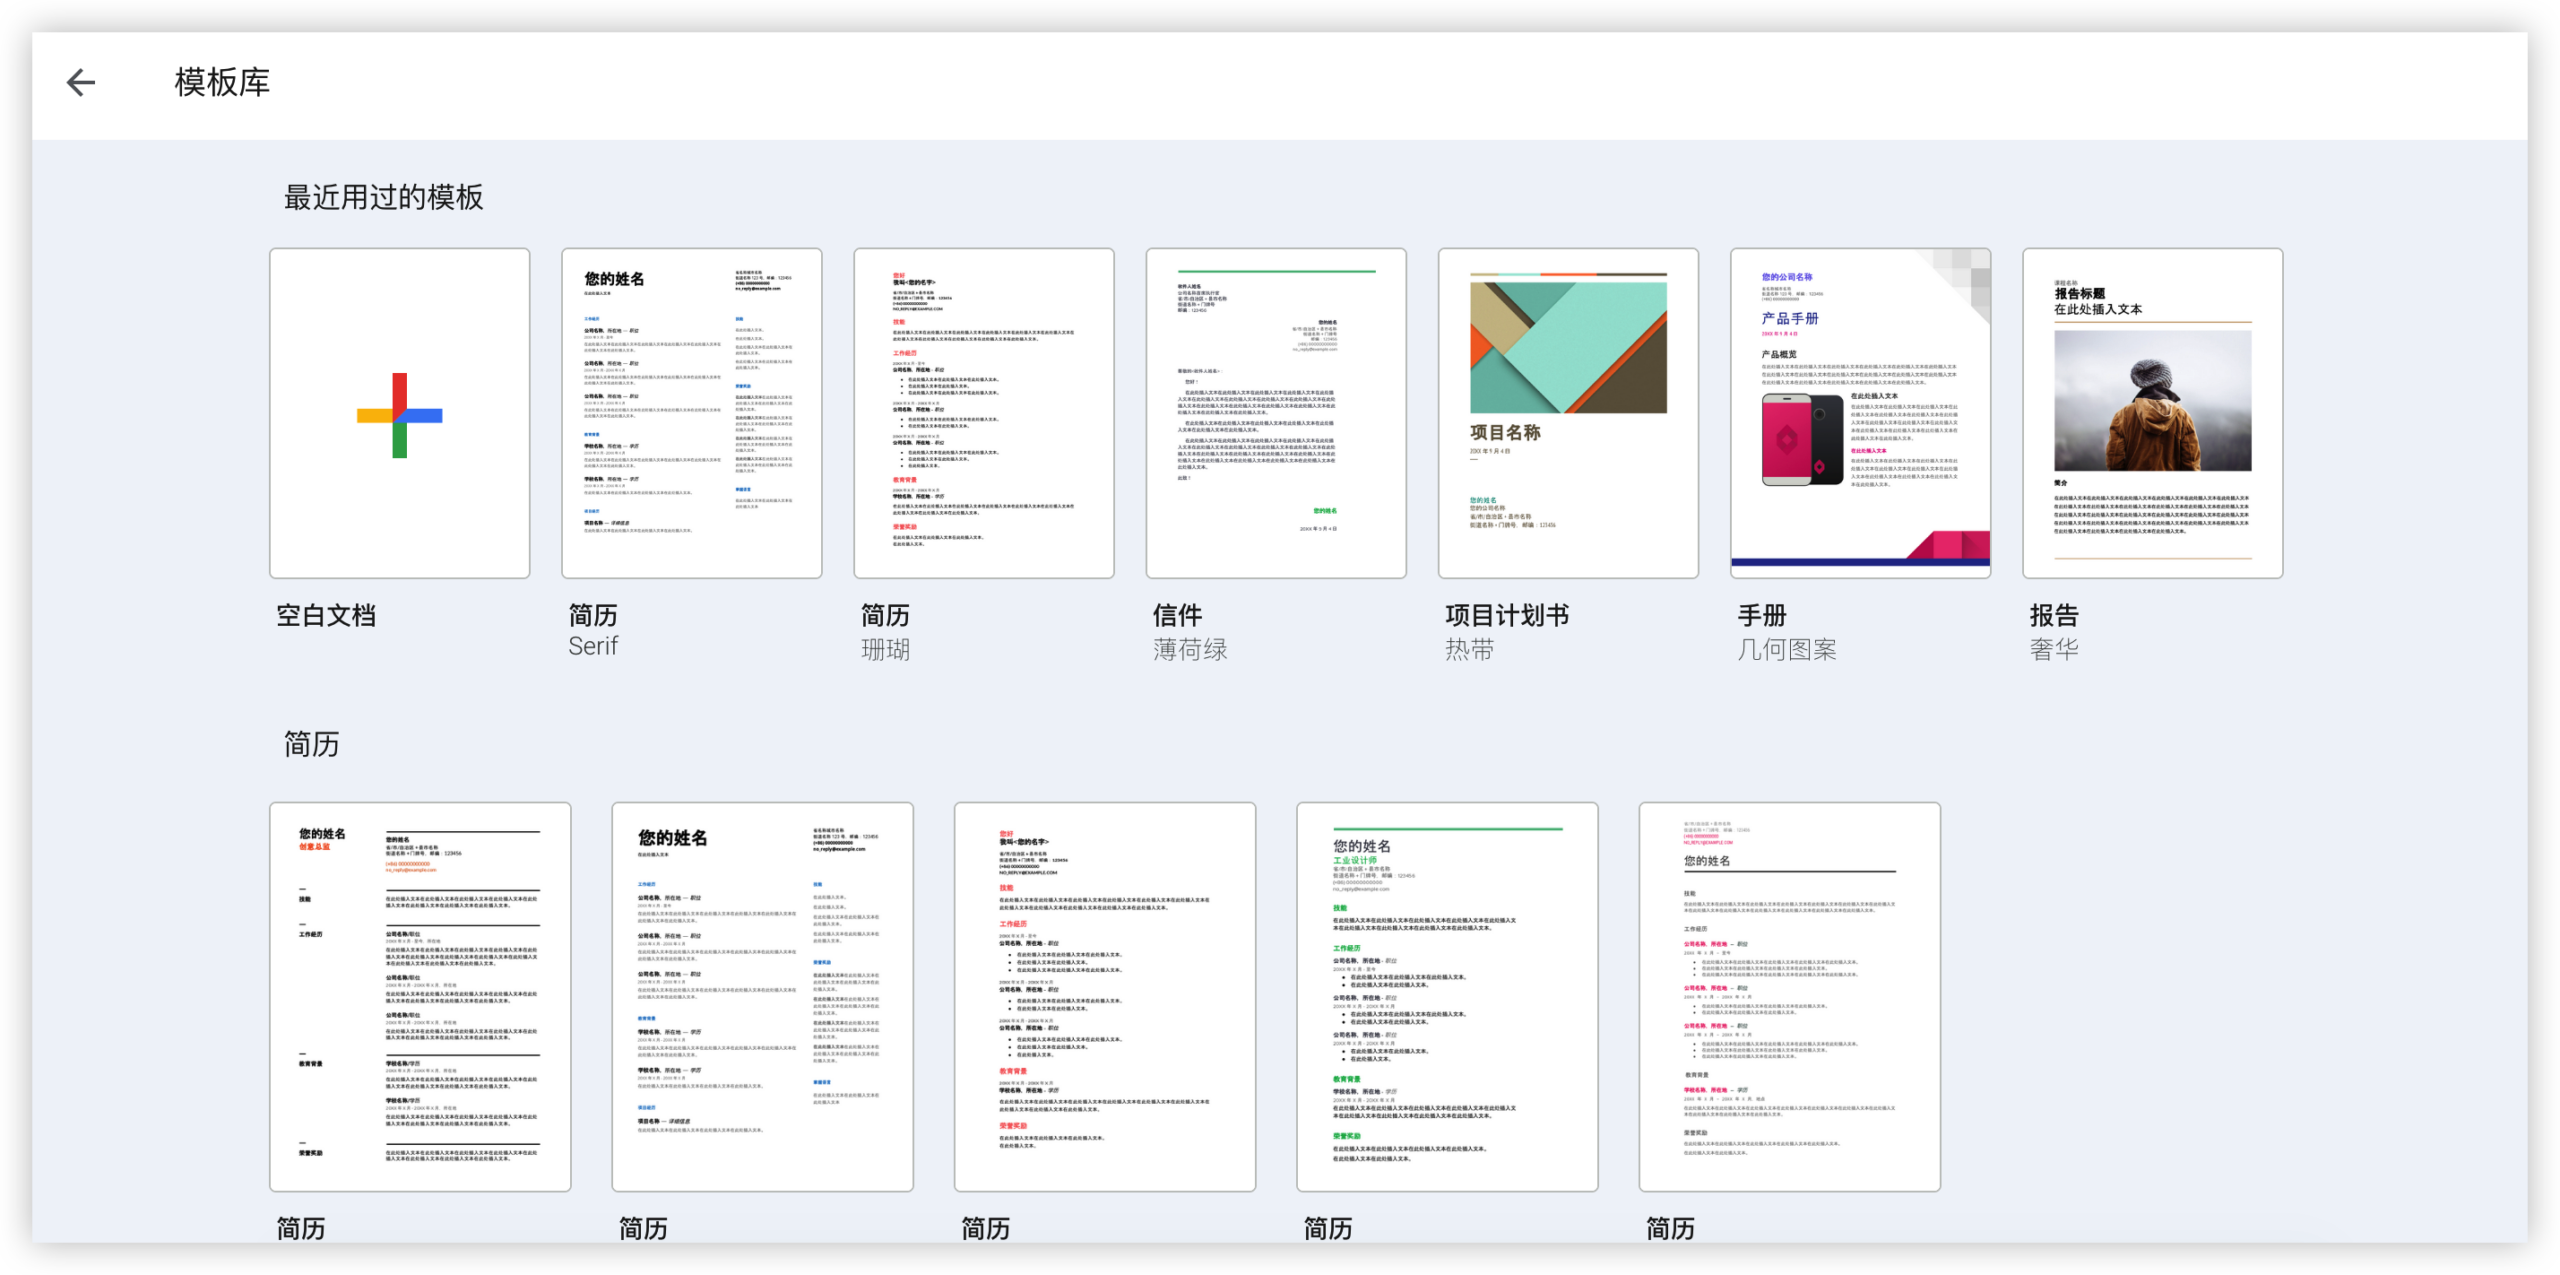
What You Need Before You Start
Prepare the project details before building the chart. You will need:
- A list of tasks
- A start date for each task
- An end date or estimated duration
- The person responsible for each task
- A timeline scale, such as days or weeks
- Important milestones and deadlines
For a small marketing launch, your task list might include writing the landing page, designing graphics, reviewing the campaign, and publishing the final version.
Step 1: Open a Blank Google Docs Page
Open Google Docs and create a new blank page. Give the page a clear heading, such as “Website Launch Schedule,” so readers immediately understand the chart’s purpose.
Keep the page in landscape orientation if your timeline includes more than a few weeks. Select File, choose Page setup, and switch the orientation to Landscape.
Although the menu uses the word “File,” avoid adding unrelated content above the chart. A short project heading and one sentence of context are usually enough.
Step 2: Choose Your Timeline Scale
Decide whether each timeline column will represent a day, week, or month. Your choice depends on the project length and the level of detail you need.
- Use days for short projects, such as a five-day event launch.
- Use weeks for campaigns, product releases, or development sprints.
- Use months for annual plans, construction work, or long-term initiatives.
For example, a six-week website redesign could use six timeline columns. A three-month product launch might use one column for each week, giving you roughly twelve timeline columns.
Here's why: too much detail makes the chart difficult to read, while too little detail hides scheduling problems. Choose the smallest useful time unit.
Step 3: Insert a Table
Place your cursor below the project heading. Select Insert, choose Table, and create a table with enough rows and columns for your schedule.
Start with these columns:
- Task
- Owner
- Start
- End
- Timeline periods
Add one row for every task, plus a header row. If your project has eight tasks and six weekly periods, create at least ten rows and ten columns.
The first four columns describe the work. The remaining columns become the visual timeline. You can add more rows later, but starting with a reasonable size keeps the layout easier to control.
Step 4: Add Task and Date Details
Enter one task per row. Keep task names short enough to fit without making the timeline too narrow.
For example, use “Approve homepage copy” instead of “Review and provide final approval for all homepage copy and supporting messages.”
Then add the responsible person, start date, and end date. A simple schedule might look like this:
| Task | Owner | Start | End | Week 1 | Week 2 | Week 3 |
|---|---|---|---|---|---|---|
| Research audience | Maya | May 6 | May 10 | |||
| Write page copy | Jon | May 13 | May 17 | |||
| Design page | Leo | May 20 | May 24 |
You can use full dates, abbreviated dates, or date ranges. Use the same style throughout the chart to prevent confusion.
Step 5: Label the Timeline Columns
Replace generic timeline headings with useful periods. For a weekly chart, use labels such as “May 6–10,” “May 13–17,” and “May 20–24.”
Short labels usually work best. If a heading becomes too wide, use “Wk 1,” “Wk 2,” and “Wk 3,” then add the date range in a note below the chart.
Keep the periods in chronological order. A reversed or inconsistent timeline can make a task appear to happen before its actual start date.
Let me explain: the timeline headings are the chart’s visual reference point. If they are unclear, colored cells lose much of their meaning.
Step 6: Color the Task Duration
Highlight the cells that correspond to each task’s active period. Select a cell, open the cell background color control, and choose a fill color.
For example, if “Write page copy” runs during Week 2, color the Week 2 cell in that row. If a task lasts three weeks, color all three matching cells.
You can use one color for regular work and another color for milestones. For example:
- Blue for active work
- Green for completed tasks
- Yellow for review periods
- Red for blocked or delayed work
- Dark gray for milestones
Use a small color legend below the table. Avoid using too many colors because readers may struggle to remember what each one means.
The best part? You do not need perfect visual design. Consistent colors, readable labels, and accurate dates matter more than decorative formatting.
Step 7: Format and Review the Chart
Adjust the table before sharing it. Drag column borders to give task names more room and make timeline columns narrow but readable.
Apply bold formatting to the header row. Add a background color to the header, align date and timeline cells consistently, and use a readable font size.
Then review the schedule carefully:
- Check that every task has an owner.
- Confirm that start dates come before end dates.
- Make sure colored cells match the stated duration.
- Look for gaps between dependent tasks.
- Identify tasks scheduled at the same time.
- Confirm that milestones stand out clearly.
Share the page with the appropriate access level. If several people will update it, explain who is responsible for changing task status and dates.
How the Manual Timeline Method Works
The chart uses two visual layers. The left side explains the work, while the right side shows when the work happens.
Imagine a row labeled “Test checkout process.” If the task runs from Week 3 through Week 4, color those two timeline cells. The row now communicates both the task and its planned duration.
This method works well for small projects because it is easy to understand at a glance. A five-person team planning a two-week event can often create the chart in less than twenty minutes.
However, every timeline update requires manual changes. If testing moves from Week 3 to Week 4, you must update the date fields and adjust the colored cells yourself.
When a Google Docs Gantt Chart Works Well
A manually created chart is useful when the schedule is simple and the main goal is visibility.
- Small teams need a shared planning overview.
- A client needs a printable project schedule.
- You are presenting a high-level timeline during a meeting.
- The project has fewer than twenty major tasks.
- Dates rarely change after approval.
For example, a freelance designer might use one chart to show discovery, wireframing, visual design, revisions, and handoff. The client can understand the sequence without learning a new planning system.
The format also works for classroom projects, content calendars, event planning, and simple renovation schedules.
When This Approach Starts to Break Down
The manual method becomes harder to maintain as the project grows. A chart with forty tasks and twelve weekly columns can become crowded and slow to update.
It also lacks automatic relationships between tasks. If “Develop checkout” is delayed, Google Docs will not automatically move “Test checkout” or warn you about the impact.
You may also struggle with:
- Tracking task dependencies
- Recording progress percentages
- Managing several project views
- Filtering tasks by owner
- Reporting schedule changes
- Keeping old and new dates visible
You might be wondering: when should you move beyond a manually colored table? Consider another approach when updates happen daily, several teams share the schedule, or missed dependencies create real costs.
Google Docs Gantt Chart vs. Dedicated Project Planning
Google Docs is convenient for a visual overview. Dedicated project planning platforms are stronger when you need structured scheduling, automation, permissions, reporting, and ongoing progress tracking.
| Need | Manual Google Docs chart | Project planning platform |
|---|---|---|
| Quick visual overview | Strong | Strong |
| Manual formatting | Required | Usually reduced |
| Task dependencies | Limited | Built in more often |
| Automatic schedule changes | Unavailable | Often available |
| Progress reporting | Manual | Structured and reusable |
| Small one-time project | Good fit | May be unnecessary |
The right choice depends on the cost of change. A simple chart may be enough for a short event, while a product launch with cross-team dependencies needs stronger controls.
A More Scalable Project Planning Solution: ONES.com
ONES.com combines project management and knowledge management in one platform. ONES Project supports structured planning for teams that have outgrown manually maintained timelines.

It can be useful when you want the clarity of a Gantt-style schedule alongside task workflows, reporting, automation, and controlled access.
Core Capabilities
Manual schedule updates create rework → Custom workflows and fields → Each task carries the information your team needs
When a planning table grows, people often add notes in inconsistent places. ONES Project lets you create custom workflows and fields for status, priority, owner, risk, and schedule details.
That structure makes project information easier to review and reduces repeated clarification messages.
Changing priorities are difficult to visualize → Sprint management → Teams can organize short delivery cycles clearly
Product and engineering teams often plan work in sprints rather than broad calendar blocks. Sprint management gives each cycle a defined scope and review point.
For example, a team can separate planned work, active tasks, testing, and completed items within one delivery rhythm.
Repeated actions consume planning time → Automation → Routine transitions happen with fewer manual steps
A task can move to review after development finishes, notify an owner when a deadline approaches, or update a status after a required action.
Automation helps reduce small administrative tasks that are easy to forget during busy project periods.
Teams need different progress views → Built-in reporting → Leaders can monitor progress without rebuilding charts
Built-in reporting helps you review workload, completion trends, bottlenecks, and overdue work. You can use those views for status meetings and planning decisions.
This is more reliable than recoloring a timeline whenever the schedule changes.
Existing Jira workflows create migration concerns → Jira-compatible workflows → Teams can preserve familiar working patterns
ONES Project supports Jira-compatible workflows, which can make adoption easier for teams already familiar with issue-based planning.
You can carry familiar process ideas into another project environment without recreating every practice from the beginning.
Plugin-heavy setups increase maintenance → Native project capabilities → Teams can reduce dependence on add-ons
When essential planning functions require several plugins, upgrades and permissions can become harder to manage. ONES Project includes custom workflows, custom fields, sprint management, automation, and reporting as native capabilities.
That can simplify administration for teams that prefer a more unified setup.
Restricted environments limit cloud choices → On-premise, private cloud, and air-gapped deployments → Teams can match planning to infrastructure requirements
ONES.com supports Cloud, On-Premise, Private Cloud, and Air-gapped deployments. The self-hosted versions provide feature parity with the cloud version.
This gives teams more flexibility when security, network isolation, or internal hosting requirements shape their technology decisions.
Project knowledge becomes scattered → ONES Wiki → Teams can connect planning with shared knowledge
ONES Wiki provides a knowledge management space for procedures, meeting notes, requirements, and team guidance.
Keeping project work and team knowledge within the same platform can make it easier to connect a task with the explanation behind it.
Application Scenarios
Software release planning
A product team can organize features, defects, testing tasks, release approvals, and sprint work in one planning environment. Reporting helps managers identify blocked work before the release date becomes urgent.
Marketing campaign coordination
A marketing team can track research, copywriting, creative production, legal review, launch preparation, and post-launch analysis. Custom fields can show campaign type, channel, owner, and approval status.
Projects in restricted networks
An organization with strict network controls can use an on-premise, private cloud, or air-gapped deployment. Teams retain structured project planning while fitting the platform to internal infrastructure requirements.
Common Challenges and Practical Fixes
1. The chart becomes too wide
Problem: Daily columns can make the page difficult to read, especially for projects lasting several weeks.
Solution: Use weekly periods for the main view. Keep daily detail in a separate planning area or add it only for short, high-risk phases.
2. Colors are difficult to interpret
Problem: Several colors may look attractive but create uncertainty about status and meaning.
Solution: Limit the chart to three or four colors. Add a small legend and use labels such as “planned,” “active,” “complete,” and “blocked.”
3. Dates become outdated
Problem: A manually colored timeline can remain unchanged after the schedule moves.
Solution: Assign one person to review the chart during each project meeting. Update dates and colored cells together.
4. Dependencies are unclear
Problem: A table shows timing, but it does not automatically explain why one task must wait for another.
Solution: Add a “Depends on” column. For example, label “Publish campaign” as dependent on “Approve campaign copy.”
5. The chart includes too much detail
Problem: Adding every small action makes the schedule overwhelming.
Solution: Show major deliverables in the main chart. Track small actions separately and link them through clear task names or milestone labels.
FAQs
Can Google Docs create a Gantt chart automatically?
No. Google Docs does not include a native Gantt chart generator. You create the visual schedule manually with a table, date headings, and colored cells.
That approach works for simple projects. If you need automatic dependencies, progress calculations, or schedule adjustments, a dedicated project planning platform will be more suitable.
Can I make a Gantt chart in Google Docs without using Google Sheets?
Yes. You can build the entire chart inside Google Docs with the table tool. Add task details in the left columns, create timeline periods across the top, and color the cells that represent task duration.
Google Sheets may be more convenient for calculations, but it is not required for a basic visual schedule.
How many columns should a Google Docs timeline have?
Use enough columns to show the project’s meaningful planning periods without making the page unreadable. A short project may need five daily columns, while a longer project may work better with six to twelve weekly columns.
When the timeline becomes too wide, switch to a larger time unit or use landscape orientation.
How do I show milestones in the chart?
Create a separate row for each milestone and use one distinct color in the period when it occurs. You can also add a diamond symbol, bold text, or a label such as “Launch” or “Approval complete.”
Keep milestone formatting consistent so readers can recognize important events quickly.
Can several people edit the same Gantt chart?
Yes. Share the Google Docs page with the people who need access, then decide who can edit, comment, or view it.
For smoother collaboration, assign responsibility for schedule updates. Without clear ownership, several people may change dates or colors inconsistently.
When should I use project management software instead?
Consider dedicated software when your schedule changes frequently, contains many dependencies, or requires regular progress reports. It is also useful when several teams need separate views of the same project.
A manually maintained chart remains practical for small, stable plans. The main question is whether updating the chart takes longer than planning the work.
Conclusion
You can create a useful Gantt chart in Google Docs by building a table, choosing a practical timeline scale, entering task details, coloring active periods, and reviewing the schedule regularly.
The method is affordable and easy to explain. It works especially well for small projects, simple presentations, and schedules that do not change often.
But here's the truth: manual charts become harder to maintain when dependencies, reporting, automation, and frequent changes enter the picture. Start with Google Docs when a clear visual overview is enough. Move to a structured platform such as ONES.com when your team needs a more scalable way to plan and manage work.