How to Make a Gantt Chart in Google Docs: 7 Easy Steps (2026)
Gantt charts make project timing easier to understand, yet creating one in Google Docs can feel surprisingly awkward. You may start with a blank page, uncertain table settings, confusing dates, and bars that refuse to line up.
That frustration grows when a simple timeline turns into a crowded grid. A small change to one task can force you to recolor several cells and rebuild the layout.
Here’s the practical solution: create a clean table, use columns as time periods, shade cells as task bars, and keep the chart easy to update. I’ll walk you through seven simple steps, plus faster options for complex projects.
How to Make a Gantt Chart in Google Docs
You can create a Gantt chart in Google Docs by building a table with tasks, dates, and timeline columns, then shading cells to represent task duration.
This approach works well for short projects with a manageable number of tasks. It gives you a visual schedule without requiring specialized project management software.
1. Define Your Project Tasks
Start by listing every major task your project needs. Keep each task specific enough to have a clear start date and finish date.
For example, a website launch might include these activities:
- Gather requirements
- Create the page structure
- Write page content
- Design the visual layout
- Build the website
- Review and test the pages
- Publish the site
Avoid combining unrelated work into one vague task. “Launch website” hides several deadlines, while “Test checkout flow” gives you a trackable activity.
At this stage, estimate the duration of each task. You can use days, weeks, or months, depending on the project’s size.
2. Choose a Time Scale
Decide whether your chart should show days, weeks, or months. Your choice depends on how precisely you need to manage the schedule.
- Use days for short campaigns, events, or software sprints.
- Use weeks for marketing projects, product launches, or design work.
- Use months for long-term programs, construction work, or annual planning.
For a four-week project, weekly columns keep the layout readable. Daily columns would create too many narrow cells.
Here’s why: a Gantt chart becomes less useful when the timeline is so crowded that you cannot quickly identify task overlaps.
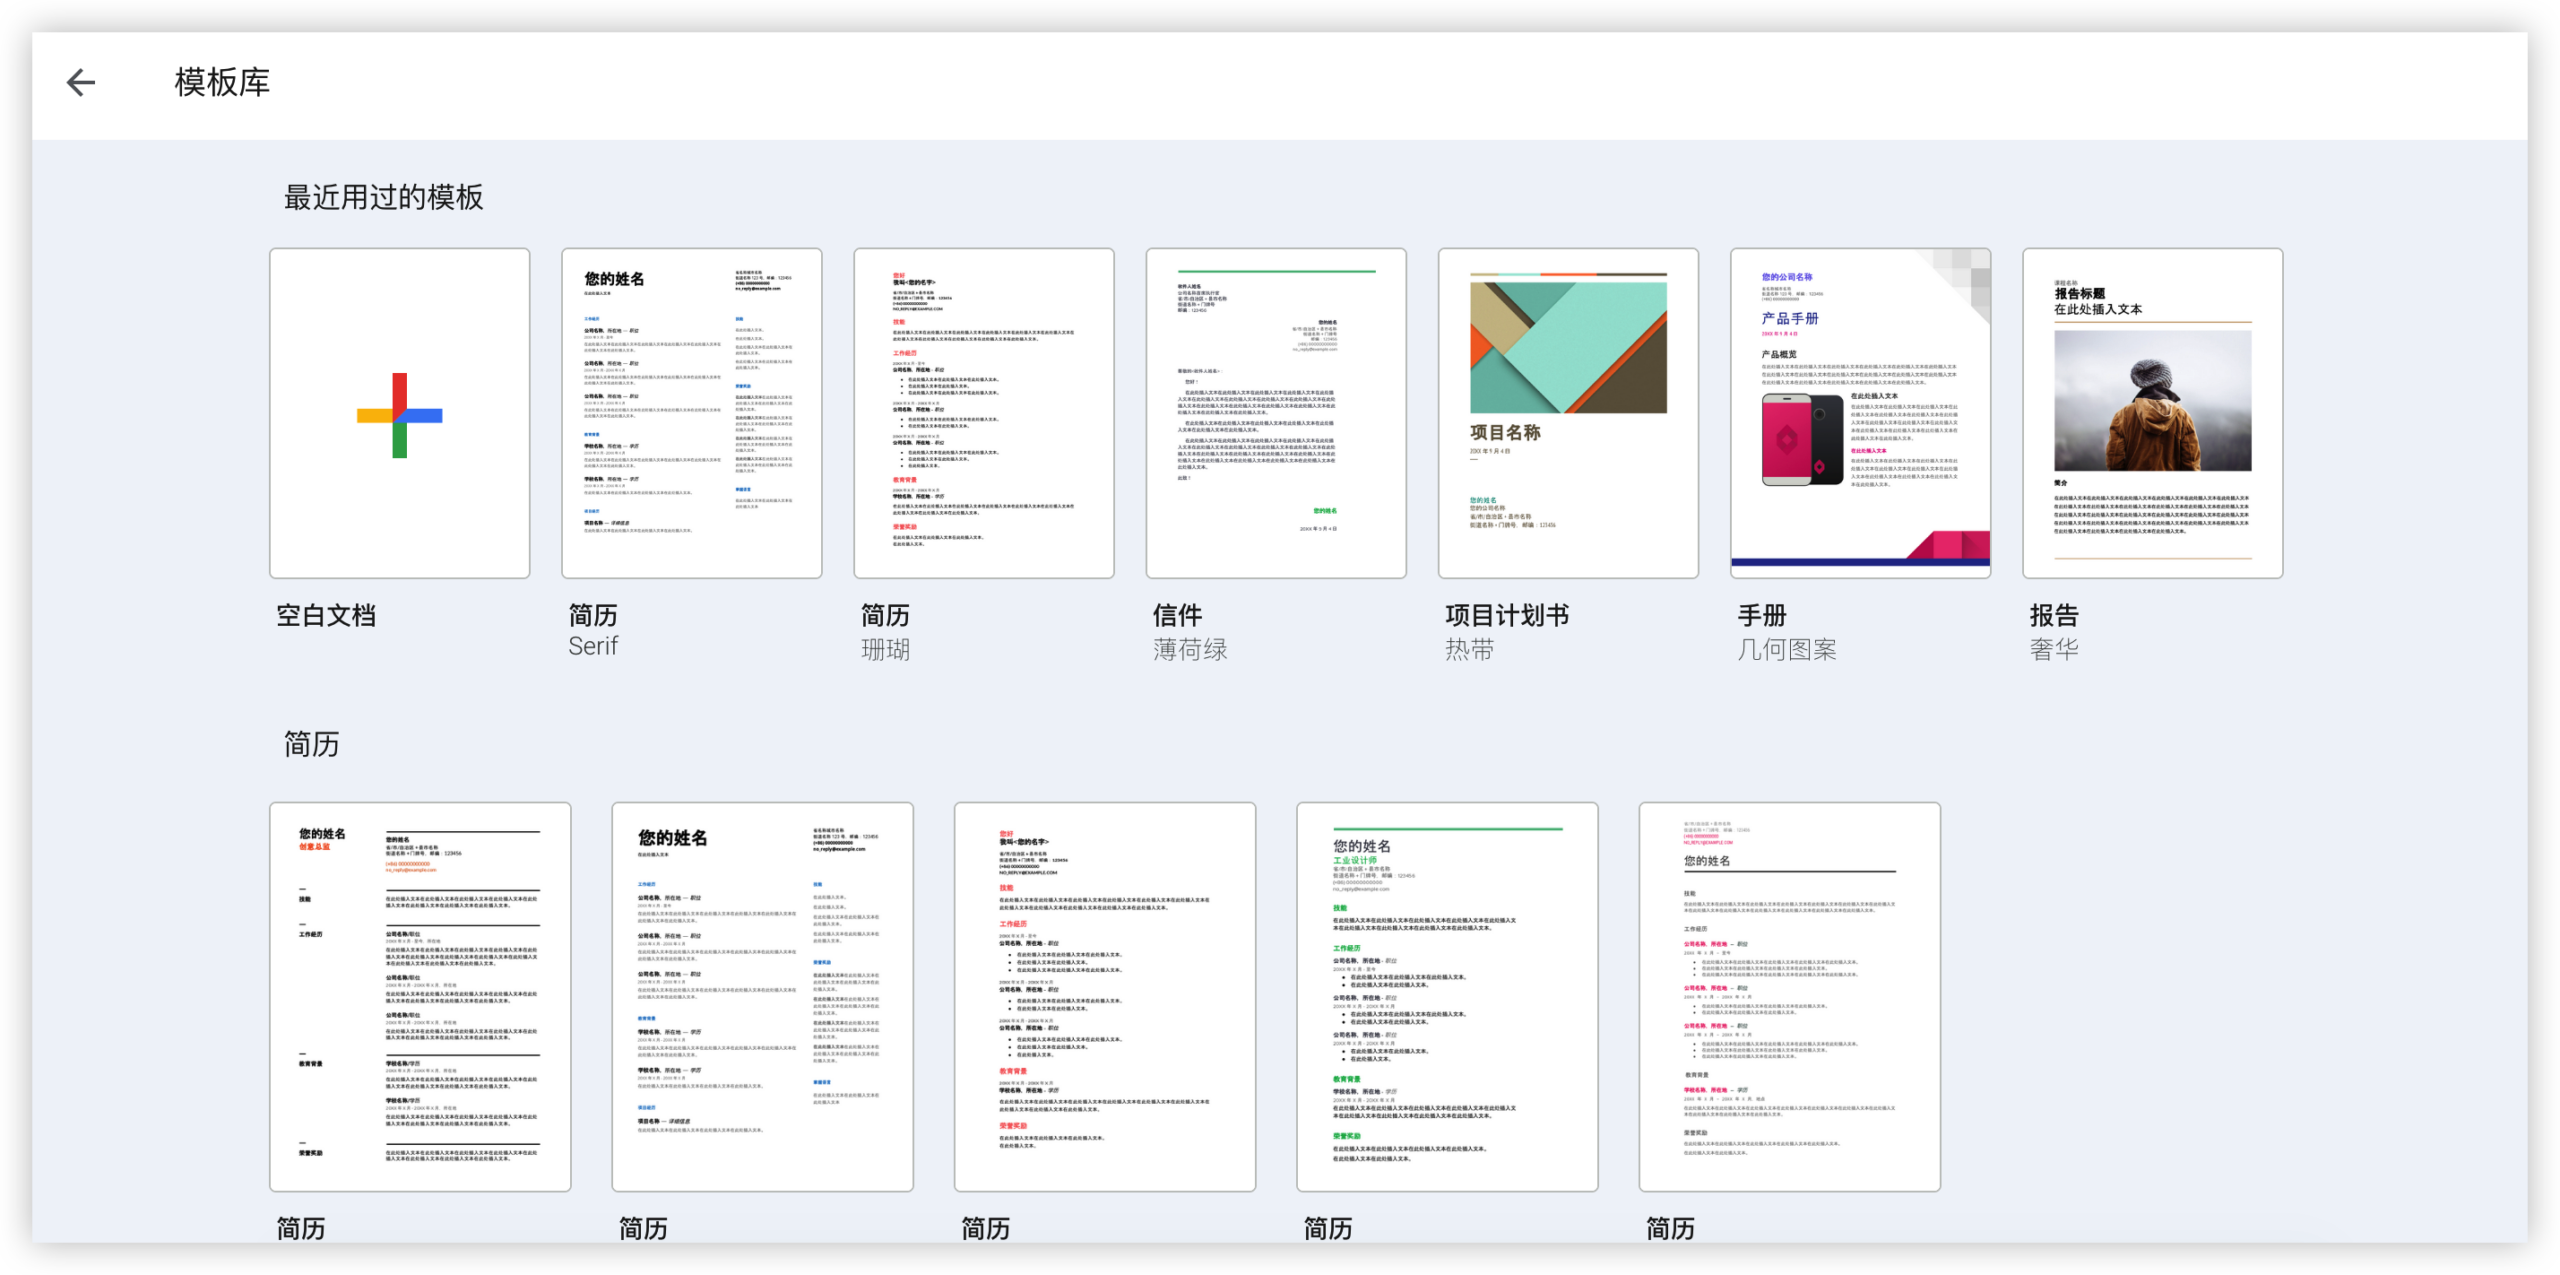
3. Insert a Table in Google Docs
Open Google Docs and create a blank page or open an existing project plan. Place your cursor where you want the chart to appear.
Choose Insert, select Table, and create enough columns for your task details and timeline.
Use the first columns for planning details:
- Task name
- Owner
- Start date
- End date
Add one timeline column for every period you selected. For example, a six-week project may need four detail columns and six weekly columns.
Your table could look like this:
| Task | Owner | Start | End | Week 1 | Week 2 | Week 3 | Week 4 |
|---|---|---|---|---|---|---|---|
| Design layout | Alex | May 6 | May 17 | ||||
| Build pages | Jordan | May 13 | May 31 |
You can add rows later by right-clicking a cell and choosing the appropriate row option.
4. Add Timeline Labels
Use the top row to label every time period clearly. Include the month, week number, date range, or project phase.
For example, you might label columns as follows:
- May 6–12
- May 13–19
- May 20–26
- May 27–June 2
Short labels make the chart easier to scan. If a date range feels too long inside a cell, use “W1,” “W2,” and add a small legend above the chart.
Keep the timeline in chronological order. A reversed or inconsistent sequence makes task durations difficult to interpret.
5. Shade Cells to Create Task Bars
Now turn the timeline into visual bars. Select the cells covering each task’s active period, then use the cell background color control.
Choose one main color for planned work. You can add a second color for milestones, reviews, or blocked tasks.
For example, if “Design layout” runs from Week 1 through Week 2, shade those two cells. If “Build pages” runs from Week 2 through Week 4, shade three cells.
The result might look like this:
| Task | Week 1 | Week 2 | Week 3 | Week 4 |
|---|---|---|---|---|
| Design layout | Work | Work | ||
| Build pages | Work | Work | Work |
Use the same color consistently. A blue bar should mean the same thing throughout the chart.
6. Format the Chart for Readability
A usable Gantt chart should be clear before it becomes decorative. Adjust the table so the task names remain readable and the timeline stays compact.
- Bold the header row.
- Use a light background for headers.
- Center timeline labels and colored cells.
- Keep task names left-aligned.
- Use a consistent font size.
- Reduce unnecessary text inside timeline cells.
Wider task columns help with longer names. Narrower timeline columns preserve horizontal space.
Let me explain: the chart communicates through position and color. Extra words inside every cell compete with the visual schedule.
7. Add Milestones and Review the Schedule
Mark important events that do not require several days. Examples include approval, launch, testing complete, or stakeholder review.
You can use a contrasting color, a symbol, or a short label such as “M” for a milestone. Add a legend so everyone understands the meaning.
Then review the chart for three problems:
- Tasks with missing dates
- Overlapping work assigned to the same person
- Deadlines that arrive before prerequisite work finishes
Ask whether each task has enough time and whether the sequence makes sense. A chart should reveal scheduling problems before work begins.
How the Google Docs Gantt Chart Method Works
A Gantt chart uses horizontal bars to show when activities start, how long they continue, and when they finish.
In Google Docs, the table acts as the chart’s structure. Each timeline cell represents a period, while shading creates the task bars.
Task Rows Show Responsibility
Each row represents one activity. Adding an owner column makes responsibility visible without crowding the timeline.
For example, a row labeled “Prepare product photos” can show the assigned person, expected dates, and active weeks together.
Timeline Columns Show Duration
Each column represents an equal time interval. A colored run across three columns means the task spans three intervals.
This visual pattern helps you compare work quickly. A short bar suggests a brief activity, while a long bar signals extended effort.
Overlapping Bars Show Parallel Work
Bars that appear in the same columns indicate concurrent activities. That can improve efficiency when different people handle the work.
It can also expose a capacity problem. If one person owns four overlapping tasks, the schedule may need adjustment.
Milestones Show Key Events
Milestones represent moments rather than extended tasks. A launch date, approval checkpoint, or delivery date can appear as a distinct marker.
Milestones help you judge progress without adding unnecessary detail to the chart.
When a Google Docs Gantt Chart Works Well
This method suits small projects where the schedule changes occasionally and only a few people need editing access.
For example, a freelance designer could use it to plan a three-week branding project. The chart might include discovery, concept development, revisions, and final delivery.
Google Docs also works well when the schedule needs to sit beside meeting notes, project goals, or written instructions. You can keep planning information together on one page.
The approach becomes harder when you need automatic date calculations, task dependencies, progress percentages, or workload reporting.
Use It for Simple Planning
A short event plan may need only ten tasks and four weeks. A manually shaded table can handle that schedule without much effort.
You can also print the chart or export it for a planning meeting. Its simple layout makes it approachable for people who rarely use project tools.
Recognize the Manual Work
Google Docs does not automatically move a task bar when you change its dates. You must shade or clear cells yourself.
That matters when a deadline changes every few days. Manual formatting can create errors and consume more time than expected.
Common Mistakes to Avoid
A Gantt chart can look polished while still giving you an inaccurate picture of the schedule. Watch for these common problems.
Using Too Many Timeline Columns
Daily columns may seem precise, but they often make the chart difficult to read. Choose the smallest practical time unit.
A two-month project may work better with weekly periods than sixty narrow daily cells.
Leaving Dependencies Unclear
Colored bars show timing, yet they do not automatically explain task relationships. Add short notes for important prerequisites.
For example, write “Begins after approval” beside a production task. This prevents readers from assuming every activity can start immediately.
Mixing Color Meanings
When every color has a different meaning, readers need a legend. Without one, the chart becomes a guessing exercise.
Use a restrained color system, such as blue for work, orange for risks, and dark gray for milestones.
Forgetting a Current-Date Marker
If the chart covers an active project, mark today’s position with a vertical line or a highlighted column.
This helps you see whether work is ahead, on schedule, or behind the planned timeline.
Ways to Keep the Chart Updated
Assign one person to maintain the schedule. Shared editing helps, though too many simultaneous changes can create inconsistent formatting.
Review the chart at a regular planning meeting. Update completed work, move delayed tasks, and record new milestones.
Keep a simple status key:
| Status | Meaning |
|---|---|
| Blue | Planned or active work |
| Green | Completed work |
| Orange | At-risk work |
| Red | Blocked work |
The best part? A small update routine prevents the chart from becoming an attractive page that no longer reflects reality.
Project Timeline Solution: ONES.com
For simple schedules, Google Docs can be enough. When your timeline includes dependencies, changing dates, multiple teams, and progress reporting, ONES.com provides a more structured workspace.

ONES.com combines project management and knowledge management through ONES Project and ONES Wiki. You can purchase them separately and use the product that matches your planning needs.
Value Proposition
ONES Project gives you a Jira alternative for managing structured work, while keeping planning, reporting, workflows, and project knowledge connected.
It supports cloud and self-hosted deployment, including on-premise, private cloud, and air-gapped environments.
Core Capabilities
- Manual timeline maintenance: A shaded Google Docs chart needs repeated formatting after date changes. ONES Project connects task dates with structured project planning, reducing repetitive updates.
- Unclear task ownership: A static table can hide responsibility across teams. ONES Project assigns work clearly, so each activity has an accountable owner.
- Hidden dependencies: A colored bar does not show which task must finish first. Dependency planning helps you understand sequencing and potential schedule impact.
- Limited progress visibility: A manual chart may show planned timing without reliable completion status. Built-in reporting gives you a clearer view of project progress.
- Rigid planning structures: A basic table rarely fits every team’s workflow. Custom workflows and fields let you reflect approvals, reviews, risks, and specialized work.
- Plugin-heavy project setups: Separate extensions can create maintenance overhead. ONES Project includes Jira-compatible workflows, sprint management, and automation in one environment.
- Scattered project knowledge: Planning details can become separated from team guidance. ONES Wiki provides a connected knowledge base for procedures, decisions, and project context.
- Restricted deployment requirements: Some organizations cannot place project information in a public cloud. ONES.com supports cloud, on-premise, private cloud, and air-gapped deployments.
- Capacity concerns: A simple chart rarely shows competing assignments clearly. Structured reporting helps teams spot overloaded people and rebalance work.
Application Scenarios
Software release planning: A development team can connect sprints, testing, approvals, and release milestones. Managers can review progress without rebuilding colored cells after every change.
Marketing campaign delivery: A campaign team can manage creative production, review rounds, launch preparation, and performance follow-up. Custom fields can capture channel, owner, and campaign stage.
Restricted-network project management: An engineering organization can use an air-gapped deployment when network controls require local operation. The self-hosted version maintains feature parity with the cloud version.
Common Challenges and Practical Solutions
Challenge: The Chart Becomes Too Wide
Solution: Switch from daily periods to weekly periods, shorten labels, or divide the schedule into phases. A compact chart is easier to read during meetings.
Challenge: Date Changes Create Extra Work
Solution: Keep the Google Docs chart for high-level communication, then manage detailed schedules in a project management platform with structured dates and dependencies.
Challenge: People Misread the Colors
Solution: Add a visible legend and use consistent colors. Explain the status key before reviewing the schedule with your team.
Challenge: The Timeline Hides Workload Problems
Solution: Add owner information and review overlapping bars by person. If several activities compete for one person’s time, adjust the sequence or assign support.
Challenge: Completed Tasks Still Look Active
Solution: Use a separate completion color or add a check mark. Update finished work during each review cycle.
FAQs
Can I create a Gantt chart directly in Google Docs?
Yes. The simplest method uses a table with task rows and timeline columns. You shade cells across each task’s active period to create horizontal bars. This works well for small projects, simple schedules, and meeting plans. Google Docs does not provide the same automatic scheduling features as dedicated project management tools, so date changes require manual updates.
Is Google Sheets better for a Gantt chart?
Google Sheets can be more flexible when you need formulas, automatic date calculations, or conditional formatting. Google Docs works better when the chart belongs beside written plans, instructions, or meeting notes. You can choose based on the schedule’s complexity. A short visual plan may fit comfortably in Docs, while a changing operational schedule may need a more structured planning tool.
How many columns should a Google Docs timeline have?
Use one column for each time period in your chosen scale. A four-week project may need four weekly columns, while a six-month plan may need six monthly columns. Include task details separately. If the table becomes too wide, use larger periods or split the schedule into phases. Readability matters more than showing every possible date.
How do I show task dependencies?
Google Docs does not automatically connect dependent tasks. You can add a notes column with phrases such as “after design approval” or “requires testing complete.” For more detailed dependency management, use a project platform that links tasks and recalculates schedule effects. This becomes especially valuable when one delayed activity affects several later tasks.
Can I make a Gantt chart template in Google Docs?
Yes. Create a reusable table with your preferred task columns, timeline labels, colors, and legend. Save it as a template or duplicate the page for future projects. Before reusing it, replace old dates, task names, owners, and status colors. A template saves setup time, though you still need to maintain each schedule manually.
When should I move beyond a manual chart?
Consider a dedicated project management platform when your schedule includes many tasks, frequent changes, several teams, dependencies, recurring work, or detailed reporting. Manual formatting becomes risky as complexity increases. If you spend more time repairing the chart than discussing the work, the planning method has reached its practical limit.
Conclusion
You can create a useful Gantt chart in Google Docs with seven steps: define tasks, choose a time scale, insert a table, label periods, shade task bars, format the layout, and add milestones.
The method is quick and approachable for small projects. It becomes harder to maintain when dates shift often or several teams depend on one another.
But here’s the truth: a chart only helps when it stays accurate. Review it regularly, clarify ownership, and use consistent status colors.
For more complex planning, ONES.com offers structured project management through ONES Project, plus connected knowledge management through ONES Wiki. That gives you a practical path from a simple visual schedule to a scalable project workflow.