How to Make a Gantt Chart in Confluence: 7 Simple Steps
A Gantt chart can turn a confusing Confluence page into a clear project timeline. Without one, deadlines hide inside paragraphs, ownership becomes unclear, and small delays can spread across the entire plan.
That creates a familiar problem: people check different pages, rely on outdated dates, and discover dependencies only after work has already started. A basic task list rarely shows how one delayed activity affects everything after it.
But here's the truth: you can create a practical Gantt view in Confluence by combining a structured task table with a timeline macro or a compatible marketplace app. Follow these seven steps, and you will have a timeline that is easier to read, update, and share.
How to Make a Gantt Chart in Confluence: 7 Steps
Confluence does not offer one identical Gantt workflow for every site. Your exact method depends on your Confluence edition, available macros, and installed apps.
The process below works as a planning framework. It helps you prepare the right information before choosing a timeline view.
-
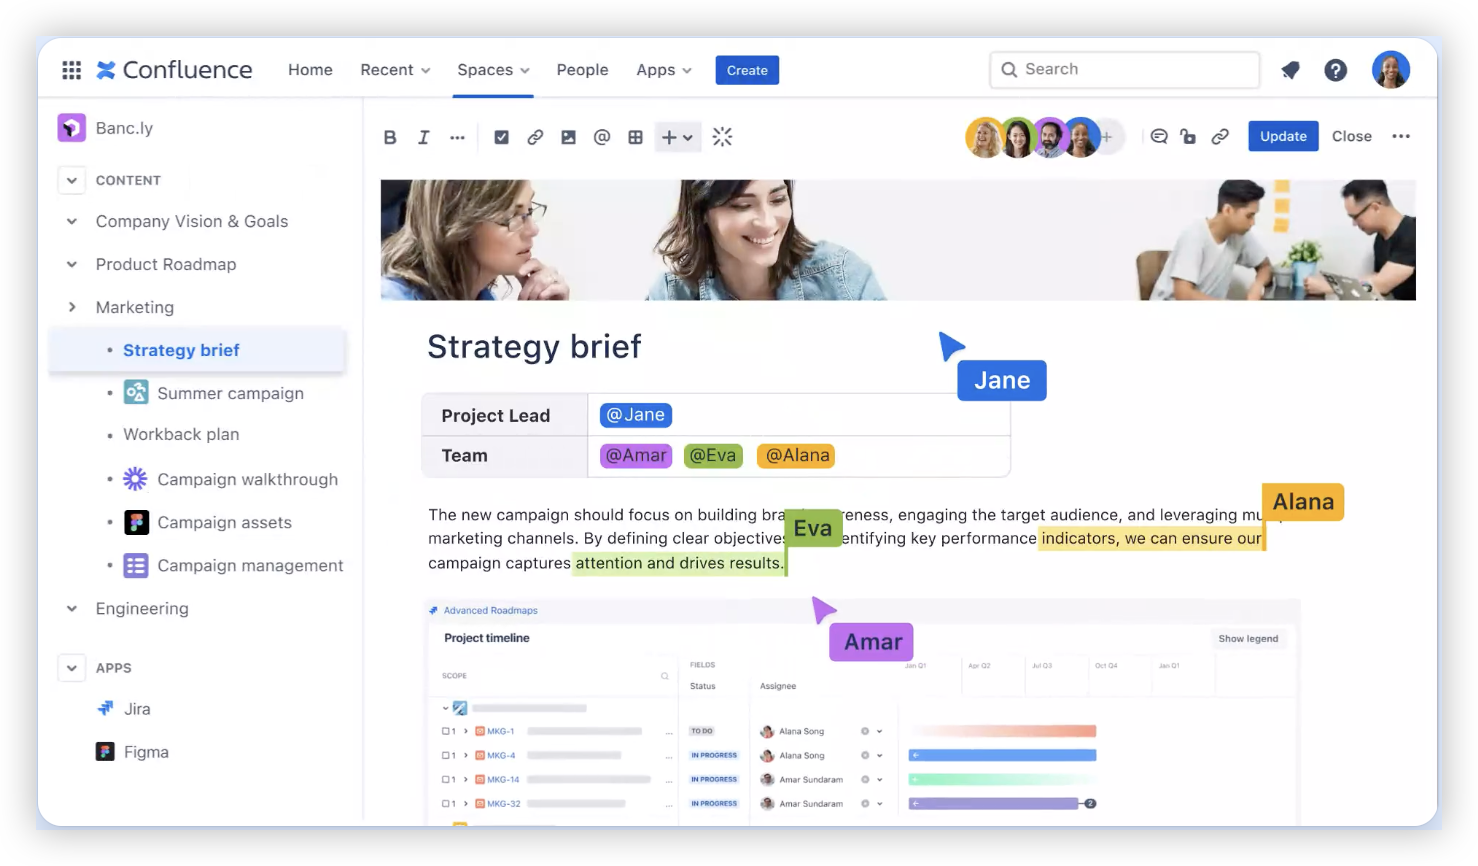
1. Create a dedicated project page
Start with a new Confluence page for the project. Give it a clear name, such as “Website Relaunch Timeline” or “Q3 Product Launch Plan.”
Keep the page focused on one initiative. Mixing unrelated work makes the timeline difficult to read and weakens accountability.
-
2. Define the work packages
Break the project into meaningful phases and tasks. For example, a website launch might include planning, design, development, testing, content review, and release.
Avoid making every tiny action a separate bar. “Approve homepage copy” is useful. “Open the writing tool” is too granular for most project timelines.
- Phase or task name
- Person responsible
- Planned start date
- Planned finish date
- Current status
- Related task or dependency
-
3. Add a structured task table
Insert a Confluence table with one row for each task. Add columns for the fields you will need to build and maintain the timeline.
For a small project, use columns such as Task, Owner, Start, End, Status, and Dependency. For a larger project, add Priority, Milestone, Team, and Notes.
Task Owner Start End Status Dependency Confirm requirements Product manager May 6 May 10 Complete None Create design concepts Design lead May 13 May 24 In progress Confirm requirements Build the first release Engineering lead May 27 June 14 Planned Create design concepts -
4. Choose a Gantt or timeline method
Search your Confluence editor for a timeline, roadmap, or Gantt macro. If your site does not include one, check whether your organization has approved a compatible marketplace app.
Some apps create a timeline from page tables. Others provide a separate planning interface that embeds into Confluence. Compare the setup effort, permissions, editing experience, and export options before committing.
You can also create a visual timeline manually with a table, colored cells, and weekly columns. That approach works for a short plan, although it becomes tedious when dates change frequently.
-
5. Map dates, milestones, and dependencies
Connect each task to its planned start and finish dates. Then mark important checkpoints, such as design approval, testing completion, or the public release.
Dependencies deserve special attention. If development cannot begin until design approval finishes, connect those activities clearly. Otherwise, the chart may look complete while hiding a serious scheduling constraint.
For example, a two-day delay in requirements approval may move design, development, testing, and release. A dependency makes that chain visible immediately.
-
6. Format the chart for quick scanning
Use consistent colors and labels. One color can represent planned work, another can show active work, and a third can identify blocked tasks.
Keep the time scale appropriate to the project. A product launch lasting six months may need monthly columns. A two-week sprint may need daily or weekly columns.
Place a short legend near the chart. Someone opening the page for the first time should understand the colors and symbols without asking for help.
-
7. Review and maintain the timeline
Set a regular review point, such as the weekly project meeting. Check completed work, changed dates, blocked activities, and newly discovered dependencies.
Assign one person to maintain the plan, while allowing task owners to report progress. This prevents several people from changing the same dates in conflicting ways.
The best part? A Gantt chart becomes valuable through maintenance, not decoration. A beautiful timeline with old dates can create more confusion than a simple current task list.
What to Prepare Before Building the Timeline
A Gantt chart is only as useful as the plan behind it. Before opening the Confluence editor, clarify the project outcome, delivery date, major phases, and people responsible for each activity.
Start with a short planning session. Ask, “What must happen before this project can finish?” Then turn each answer into a task or milestone.
- Define the final outcome in one sentence.
- List the major phases in delivery order.
- Estimate realistic durations.
- Identify activities that can happen at the same time.
- Mark approvals and external handoffs.
- Assign one accountable owner to each task.
Here's why: a timeline built from vague activities produces vague progress. “Improve the product” cannot guide scheduling. “Complete checkout usability testing” gives you a clearer finish line.
Choosing Between a Manual Chart and a Confluence App
A manual chart can work for a small team with a stable schedule. You might use a table with weekly columns and highlight the cells covering each task.
For example, a two-week campaign with eight tasks may take only a few minutes to format. If one date changes, you can adjust the colored cells directly.
As the project grows, manual formatting becomes harder to maintain. A specialized timeline app can handle date changes, dependency links, milestones, filters, and progress indicators with less repetitive editing.
| Approach | Works well for | Main limitation |
|---|---|---|
| Manual Confluence table | Short projects with few tasks | Changes require repeated formatting |
| Timeline macro | Teams needing a visual page view | Features depend on the available macro |
| Marketplace Gantt app | Complex plans with dependencies | May require extra approval or licensing |
You might be wondering: which option should you choose? Pick the simplest method that can show your dates, ownership, dependencies, and current status without constant repair.
How to Organize Tasks So the Chart Stays Readable
Group related work beneath clear phases. A product launch might contain “Research,” “Design,” “Build,” “Test,” and “Release.” This structure lets someone understand the project before reading every task.
Use milestones for events rather than activities. “Beta release” is a milestone. “Prepare beta release package” is a task with a duration.
Keep task names short and action-oriented. “Review security permissions” is easier to scan than “Security permissions need to be reviewed by the appropriate team.”
Let me explain: readability affects behavior. When the next action is obvious, people update progress more consistently. When the chart resembles a wall of text, updates tend to stop.
How to Show Dependencies and Project Risk
Dependencies reveal where the schedule can break. Common examples include approval requirements, technical handoffs, vendor work, testing environments, and legal reviews.
Mark these relationships directly in the timeline when your chosen method supports them. If it does not, add a dependency column and use consistent labels such as “blocked by,” “follows,” or “runs in parallel with.”
Suppose content review depends on approved product screenshots. If the screenshots arrive late, content review cannot finish on time. Showing that relationship helps the team act before the delay reaches launch day.
Use risk notes beside major milestones. A short note such as “Release depends on payment gateway approval” gives decision-makers useful context without making the chart crowded.
Ways to Keep a Confluence Gantt Chart Current
Choose a predictable update rhythm. A weekly review is enough for many projects, while fast-moving launches may need daily updates.
During each review, ask three practical questions:
- Which tasks finished since the last review?
- Which activities changed their expected dates?
- Which dependency or decision could affect the next milestone?
Use page history when you need to understand a major schedule change. Add a brief note explaining why a milestone moved, especially when several teams depend on it.
Archive completed plans when the work ends, and create a fresh page for a new project. Keeping every initiative in one giant timeline makes navigation slower and weakens ownership.
A Practical Confluence Gantt Chart Solution: ONES.com

Value Proposition
ONES.com combines project management and knowledge management in one platform powered by ONES Assistant. ONES Project works as a Jira alternative, while ONES Wiki provides a knowledge base similar to Confluence. They are sold separately.
For teams that need structured timelines, project reporting, and connected planning content, ONES.com can reduce the need to maintain separate planning systems and multiple plugins.
Core Capabilities
1. Scattered project planning → ONES Project → One connected workspace
When task details, milestones, and planning notes live across several places, people spend time checking for the latest status. ONES Project brings project work into a unified workspace, making the current plan easier to follow.
2. Limited workflow control → Custom workflows and fields → Better process fit
Every team handles approvals differently. Custom workflows and fields let you represent stages, ownership, priority, and project-specific information without forcing every initiative into the same template.
3. Manual progress tracking → Built-in reporting → Faster project reviews
Teams often spend meeting time collecting status updates. Built-in reporting helps you review progress, workload, and schedule information in a more consistent way.
4. Sprint work disconnected from longer plans → Sprint management → Clearer delivery rhythm
Short development cycles can become disconnected from broader milestones. Sprint management helps connect near-term work with the larger delivery schedule.
5. Repetitive project administration → Automation → Fewer routine updates
Repeated actions, such as assigning work or changing a status after approval, can consume attention. Automation handles eligible routine steps and leaves people more time for decisions.
6. Migration concerns → Jira-compatible workflows → Easier transition
Teams familiar with Jira may hesitate to change systems because established processes matter. Jira-compatible workflows can reduce the learning curve when moving project practices to a Jira alternative.
7. Plugin-heavy planning → Native feature parity → Lower configuration overhead
When essential planning functions depend on several plugins, maintenance becomes harder. ONES.com provides native parity between its cloud and self-hosted versions, helping teams keep core capabilities consistent.
8. Restricted hosting requirements → On-premise, private cloud, or air-gapped deployment → More deployment choice
Some organizations cannot place project information in a public cloud. ONES.com supports Cloud, On-Premise, Private Cloud, and Air-gapped deployments, with full feature parity between cloud and self-hosted versions.
Application Scenarios
Software release planning: A product team can manage sprint work, dependencies, approvals, and release milestones in ONES Project while keeping planning guidance in ONES Wiki.
Regulated engineering work: A team with restricted network requirements can use an air-gapped deployment while maintaining project workflows, reporting, and custom fields.
Cross-functional launches: Marketing, product, design, and engineering can track their own work while sharing milestone views and standardized status information.
Common Challenges and Practical Fixes
Challenge: Dates become unrealistic
Fix: Add capacity checks before publishing the plan. If one designer owns five overlapping activities, extend the schedule or reassign work.
Challenge: The chart contains too many tasks
Fix: Keep the main view at phase and deliverable level. Link to detailed task pages when people need deeper instructions.
Challenge: Dependencies remain hidden
Fix: Add a dependency column, connect tasks through a supported macro, and discuss the longest dependency chain during project reviews.
Challenge: People stop updating the page
Fix: Include timeline maintenance in the regular meeting agenda. Ask each owner for a date, status, and next action rather than requesting a general update.
Challenge: Confluence lacks the required visual features
Fix: Test available timeline macros or approved apps. If the project needs advanced workflow control, reporting, or multiple deployment choices, evaluate a dedicated project management platform.
FAQs
Can I create a Gantt chart directly in Confluence?
Yes, although the exact method depends on your Confluence edition and available extensions. You can create a basic timeline with a structured table and formatted date columns. For dependency links, milestones, progress indicators, and easier date changes, you may need a timeline macro or a compatible marketplace app.
Does Confluence have a built-in Gantt chart feature?
Confluence capabilities vary by edition and configuration, so you should check the macros available in your editor. Some sites include timeline-style features, while others require an approved extension. If no suitable option appears, a manually formatted table can support a small project plan.
What columns should a Confluence Gantt chart include?
Start with Task, Owner, Start Date, End Date, Status, and Dependency. Add Priority, Milestone, Team, and Notes when the project needs them. Avoid adding every possible field. A chart becomes harder to scan when people must read many columns before understanding the schedule.
How do I show dependencies in Confluence?
If your timeline macro or app supports dependency links, connect predecessor and successor tasks directly. Otherwise, add a Dependency column with consistent labels. For example, write “Design approval” beside development work that cannot begin until design finishes.
Can I use a Gantt chart for agile projects?
Yes. Use the chart for releases, milestones, dependencies, and cross-team timing rather than treating every estimate as fixed. Track sprint work separately when appropriate, then connect sprint outcomes to broader delivery goals. Review the timeline regularly because agile plans change as the team learns.
Conclusion
A useful Confluence Gantt chart starts with clear tasks, realistic dates, accountable owners, and visible dependencies. You can build a basic version with a table, use a timeline macro, or select a compatible app for more advanced scheduling.
Remember the PAS lesson: unclear project timing creates confusion, hidden dependencies increase pressure, and a maintained visual plan gives everyone a clearer path forward. Choose the simplest approach that fits your project size and update it during every meaningful review.
If your team needs Jira-compatible workflows, built-in reporting, custom fields, automation, or deployment options beyond standard cloud hosting, ONES.com offers a practical project management and knowledge management environment to evaluate.