How to Make a Gantt Chart in ClickUp: A Step-by-Step Guide
Project timelines become difficult when tasks, dependencies, and deadlines live in separate views. A simple list may show what needs doing, yet it rarely shows how one delay affects the entire project. That gap creates missed handoffs, rushed work, and uncomfortable status meetings.
The problem grows when several people update dates manually. A task can appear on schedule while its predecessor remains unfinished. By the time you notice the conflict, your delivery date may already be at risk.
But here’s the truth: you can build a useful project timeline in ClickUp by creating tasks, assigning dates, linking dependencies, and opening the Gantt view. This guide walks you through each step, explains common mistakes, and shows how to keep the timeline accurate after creation.
How to Make a Gantt Chart in ClickUp
A ClickUp Gantt chart turns tasks and dates into a visual project timeline. You can create one by adding tasks, setting start and due dates, grouping work, connecting dependencies, and opening a Gantt view.
-
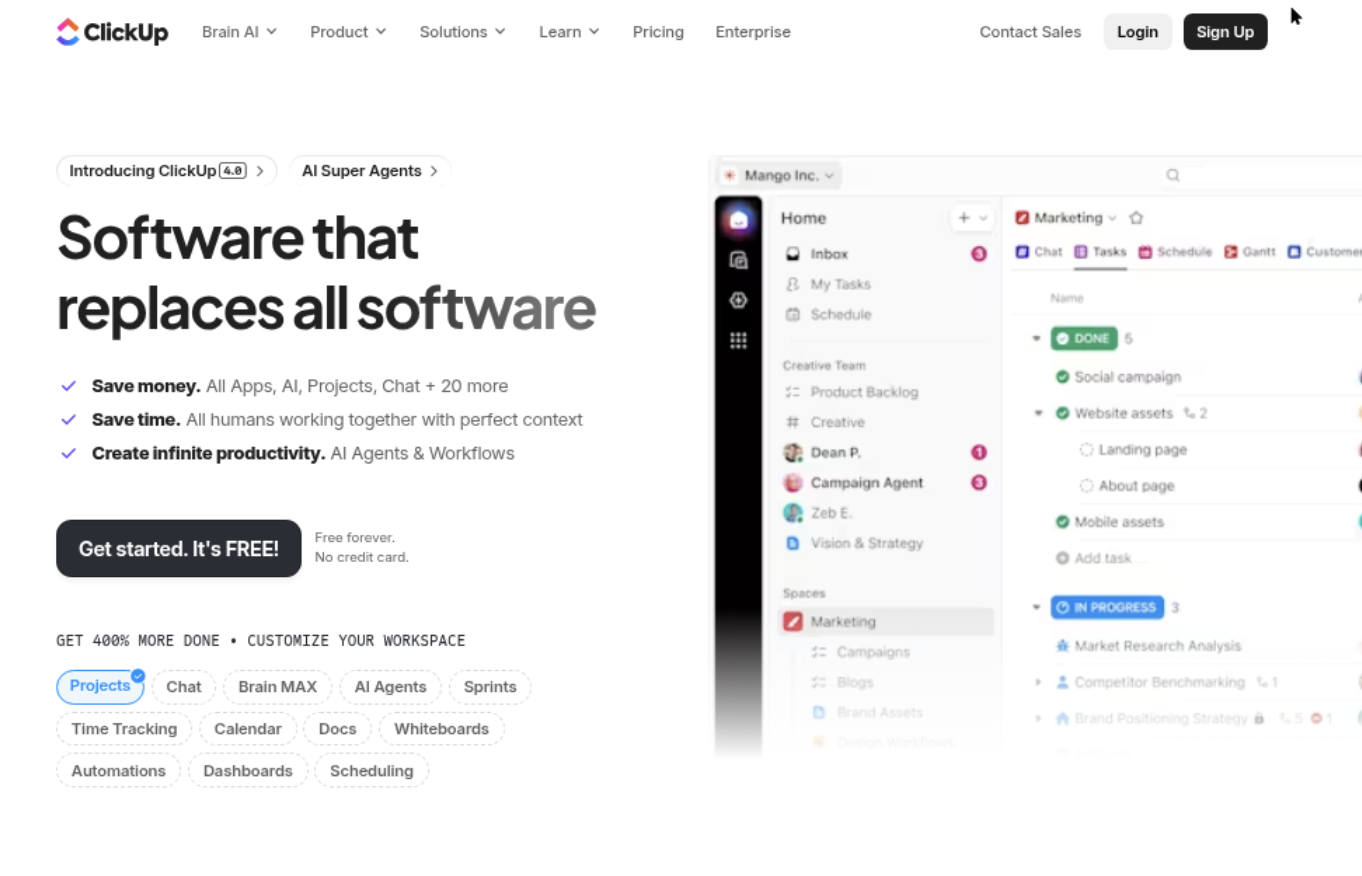
Create a Workspace, Space, or project list
Start by opening the ClickUp location where you manage the project. Depending on your setup, this may be a Space, Folder, or List.
Choose a location that matches the project’s scope. For example, a website redesign may have a dedicated Folder with Lists for research, design, development, and launch.
Keeping related work together makes the timeline easier to read. It also prevents unrelated tasks from crowding the chart.
-
Add the project tasks
Create one ClickUp task for each meaningful piece of work. Use clear names that describe an outcome, such as “Approve homepage wireframes.”
Vague names like “Design” make planning difficult. A useful task should tell you what must be completed and when the work is finished.
For a product launch, your initial tasks might include:
- Confirm launch requirements
- Write product messaging
- Design campaign visuals
- Review landing page
- Publish launch announcement
Keep tasks at a manageable size. A task that takes three weeks may hide several handoffs that deserve separate timeline entries.
-
Add start dates and due dates
Open each task and set its planned start date and due date. ClickUp uses these dates to draw the task bar across the Gantt timeline.
Use realistic estimates rather than optimistic guesses. If writing a campaign page usually takes three working days, avoid assigning only one afternoon.
For example, you could schedule:
- Requirements: May 1 to May 3
- Messaging: May 4 to May 8
- Visual design: May 6 to May 12
- Review: May 13 to May 14
Overlapping tasks can be appropriate when different people work in parallel. The chart makes that overlap visible.
-
Organize work with Lists, Folders, or task groups
Group related tasks so your Gantt chart reflects the project structure. You might group work by phase, team, deliverable, or milestone.
A software release could use groups such as planning, development, testing, and launch. A marketing campaign may use research, content, creative, approval, and promotion.
Good grouping helps you scan the chart quickly. It also makes phase-level progress easier to discuss during project reviews.
-
Open a Gantt view
Open the relevant ClickUp location and add a Gantt view. Give the view a descriptive name, such as “Website Relaunch Timeline.”
Choose the scope carefully. A view covering an entire department may become too crowded for daily planning. A project-level view usually gives you clearer detail.
Set the visible date range to match your planning horizon. Use a week or month view for active delivery work. Use a quarter view for strategic planning.
-
Connect task dependencies
Dependencies show the order between tasks. For example, “Approve wireframes” should finish before “Build landing page” begins.
In the Gantt view, connect the related tasks using ClickUp’s dependency controls. Check that each relationship describes a real constraint.
Common dependency examples include:
- Research must finish before final requirements are approved.
- Design approval must happen before development begins.
- Development must finish before testing starts.
- Testing must finish before the release goes live.
Dependencies give the timeline logic. Without them, the chart may look organized while failing to show which tasks can actually move forward.
-
Add milestones for major outcomes
Use milestones to mark important achievements, such as “Design approved,” “Beta released,” or “Campaign live.”
A milestone usually represents a decision, delivery, or change in project status. It should be easy to recognize when scanning the chart.
For example, a product team might set milestones for requirements approval, feature completion, quality acceptance, and public release.
-
Assign owners and priorities
Assign every active task to a responsible person or team. A timeline without ownership shows planned work, yet it does not show who must act.
Add priorities when some tasks deserve faster attention. High-priority work may include a regulatory review, a launch blocker, or a customer commitment.
Ownership also improves status meetings. Instead of asking who handles a task, you can discuss progress with the responsible person directly.
-
Review the critical path
Look for the chain of dependent tasks that controls the final delivery date. This chain is commonly called the critical path.
If one task on that chain slips, the project may slip unless you change the sequence, add capacity, or reduce scope.
For example, a delayed security review may block testing, release preparation, and launch. The Gantt view helps you see that effect before it becomes urgent.
-
Update the timeline during execution
A Gantt chart only stays useful when dates and task status remain current. Review the chart at least once each week during active delivery.
Move dates when the plan changes. Add new tasks when the team discovers missing work. Close completed tasks so the visual timeline reflects reality.
The best part? A short weekly update can prevent a small delay from becoming a major schedule problem.
What a ClickUp Gantt Chart Shows
A Gantt view displays tasks along a calendar timeline. Each task usually appears as a horizontal bar, with the bar length representing the planned duration.
Start and due dates determine where the bar appears. Dependencies show relationships between tasks. Milestones highlight important events. Grouping helps you understand how individual activities fit into the larger plan.
Here’s why this matters: a task list answers “What needs attention?” A Gantt chart adds “When will it happen?” and “What could it delay?”
Task duration and schedule overlap
A longer bar indicates a longer planned activity. Overlapping bars show work that may happen at the same time.
Suppose content writing runs from June 3 to June 7, while visual design runs from June 5 to June 12. The overlap may be intentional if the designer can begin with approved content sections.
That same overlap could create risk if the design team needs final copy first. Review the reason behind every overlap rather than assuming it is efficient.
Dependencies and workflow order
Dependencies connect tasks that have a timing relationship. They help you distinguish flexible work from work that must follow a specific sequence.
A launch plan may contain many tasks that can happen independently. Legal approval, however, may be required before public promotion. Connecting those tasks makes the constraint visible.
Milestones and delivery points
Milestones provide visual checkpoints. They can represent approvals, releases, completed phases, or customer handoffs.
Use milestones sparingly. If every task becomes a milestone, important delivery points lose their visual importance.
How to Build a Reliable Project Timeline
Creating the view takes minutes. Creating a reliable plan requires more thought.
Start with outcomes
Begin with the result you need to deliver. Then work backward through the activities required to reach it.
For a mobile app launch, the outcome may be “Release version 2.0 to customers.” Supporting work could include testing, store preparation, release notes, support training, and communications.
This approach reduces random task collection. Every task should connect to a deliverable, decision, or necessary operating activity.
Break large work into visible handoffs
Large tasks often hide dependencies. “Prepare campaign” may involve research, writing, design, review, approval, scheduling, and reporting.
Separate those stages when different people own them or when one stage must finish before another begins.
For example, a single “Build feature” task may hide technical design, coding, testing, security review, and deployment. Breaking it apart produces a more accurate timeline.
Estimate with evidence from similar work
Use previous project experience, team judgment, and known review cycles when estimating duration. Include time for approvals and rework.
A design task may take two days to create and another two days to review. Scheduling only the creation period creates pressure later.
You might be wondering: how much detail is enough? Add detail where timing, ownership, or dependency affects delivery. Keep low-risk administrative work simpler.
Separate planning dates from commitment dates
A tentative internal target can differ from a date promised to a customer. Label those expectations clearly in your planning process.
This distinction helps you protect buffer time. It also reduces confusion when a team member sees an early target and treats it as a final commitment.
Common Mistakes When Creating a Gantt View
Most timeline problems come from planning habits rather than ClickUp settings. Watch for these common issues.
Adding dates without adding dependencies
Dates create visual bars, yet they do not explain why tasks occur in a particular order. Without dependencies, a delayed task may fail to alert you about downstream risk.
Connect the relationships that affect delivery. You do not need to link every task in the project.
Making every task too broad
A broad task can hide several owners and stages. That makes progress difficult to measure.
Replace “Prepare launch” with specific activities such as “Approve release notes,” “Train support,” and “Schedule announcement.” Each activity should have a clear completion condition.
Planning every minute
A timeline with no buffer becomes inaccurate as soon as someone gets sick, a review takes longer, or requirements change.
Leave room for reasonable uncertainty. Add contingency around high-risk work, especially technical integrations, external approvals, and compliance reviews.
Ignoring resource conflicts
A timeline may show several tasks running in parallel, yet one person may own all of them. That creates a hidden bottleneck.
Review assignments alongside the Gantt chart. If one specialist has three overlapping deadlines, adjust the sequence or add support.
Failing to maintain the view
A stale Gantt chart can be worse than no chart. People may trust dates that no longer reflect actual progress.
Set a recurring review habit. During the review, update status, revise dates, confirm dependencies, and record new risks.
How to Use the Timeline for Team Communication
A Gantt chart works best when it supports decisions. Use it during planning meetings, weekly reviews, and risk discussions.
Use the chart before work begins
Review the proposed sequence with the people doing the work. They may identify an approval step, technical constraint, or staffing issue you missed.
For example, an engineering lead may explain that testing cannot start until a separate environment is ready. Adding that activity early protects the schedule.
Use the chart during weekly reviews
Ask three practical questions:
- Which tasks finished since the last review?
- Which tasks are at risk of missing their dates?
- Which delayed tasks could affect milestones?
These questions keep the discussion focused. They also help the team prioritize corrective action instead of simply reporting activity.
Use the chart when priorities change
Projects often change after launch goals, customer needs, or technical findings shift. The timeline helps you compare the impact of different choices.
For example, you might delay a low-priority reporting feature to protect the release milestone. The chart makes the trade-off easier to explain.
Using ONES.com for Project Timeline Management

Value Proposition
ONES.com combines project management and knowledge management in one platform powered by ONES Assistant. ONES Project supports Jira-compatible workflows, while ONES Wiki supports structured team knowledge.
It can suit teams that want visual planning, custom workflows, and deployment flexibility without assembling many separate plugins.
Core Capabilities
- Scattered project information → Unified project workspace: ONES Project brings tasks, schedules, sprint work, and reporting into one project management environment. The result is easier coordination across delivery stages.
- Unclear task relationships → Custom workflows: You can define workflow stages that match your approval and delivery process. This helps each task move through recognizable states.
- Hidden delivery risk → Built-in reporting: Reporting helps you review progress, workload, and schedule signals without constructing a separate reporting process.
- Rigid planning fields → Custom fields: Add fields for release versions, risk levels, departments, approval states, or business priorities. This gives your timeline more useful context.
- Manual sprint coordination → Sprint management: Plan sprint work, track progress, and connect iterative delivery with broader project goals.
- Repeated administrative work → Automation: Automate routine actions such as assigning work, changing statuses, or triggering follow-up steps. This can reduce missed handoffs.
- Jira migration concerns → Jira-compatible workflows: Teams seeking a Jira alternative can preserve familiar workflow concepts while adapting the workspace to their own operating model.
- Plugin-heavy administration → Native capability: Core project management functions are available within the platform, which can reduce reliance on multiple add-ons.
- Deployment restrictions → Four deployment choices: ONES.com supports Cloud, On-Premise, Private Cloud, and Air-gapped deployments. Teams can select an arrangement that fits their security requirements.
- Limited rollout budget → Free plan for 30 seats: A team can begin with up to 30 seats and evaluate its planning process before expanding adoption.
Application Scenarios
Software release planning: A development team can connect requirements, sprint work, testing, approval, and release activities. Project reporting can help managers see whether a milestone remains achievable.
Regulated or restricted environments: A team with strict network controls can consider an On-Premise, Private Cloud, or Air-gapped deployment. This supports project coordination where public cloud access is limited.
Cross-functional product launches: Product, design, engineering, marketing, and support teams can coordinate through shared workflows. ONES Wiki can hold launch guidance while ONES Project tracks delivery activities.
Common Challenges and Practical Solutions
Challenge: The chart contains too many tasks
Solution: Create a summary view for leadership and a detailed view for the delivery team. Keep the executive view focused on phases, milestones, and major risks.
Challenge: Dependencies keep changing
Solution: Review dependencies whenever scope changes. Remove relationships that no longer represent real constraints, then add any newly discovered blockers.
Challenge: Dates become unrealistic
Solution: Compare estimates with actual completion times. If reviews regularly take three days, reflect that pattern in future planning.
Challenge: Team members forget to update progress
Solution: Make timeline updates part of an existing weekly meeting. Ask each owner to confirm status, next action, and delivery risk.
Challenge: The project has several possible delivery dates
Solution: Create scenarios for different staffing or scope choices. For example, compare the schedule with one engineer against the schedule with two engineers.
FAQs
Can I create a Gantt chart directly in ClickUp?
Yes. ClickUp includes a Gantt view that displays tasks across a timeline. Add tasks to a relevant location, set start and due dates, then create or open the Gantt view. You can organize tasks, connect dependencies, and add milestones. The exact controls may vary by workspace plan and interface version, so check the options available in your account.
Do ClickUp tasks need start and due dates?
Start and due dates are essential for meaningful timeline bars. A due date alone may show a deadline, yet it does not communicate duration clearly. Add both dates when you know when work should begin and finish. For uncertain work, use an initial estimate and revise it after the team learns more.
How do dependencies help in a ClickUp Gantt chart?
Dependencies show that one task affects another task’s timing. For example, testing may depend on development finishing first. When the earlier activity slips, you can review the downstream schedule and respond sooner. Use dependencies for genuine workflow constraints. Linking every task can make the chart harder to understand.
What is the difference between a task and a milestone?
A task represents work that someone performs, such as writing requirements or testing a feature. A milestone represents a significant point, such as approval, completion of a phase, or release. Tasks usually have duration. Milestones are commonly used as checkpoint events with little or no duration.
How often should I update a Gantt chart?
Update it weekly during active project work. High-risk projects may require updates several times each week. Refresh dates when scope, staffing, dependencies, or approvals change. Closing completed tasks and recording delays keeps the timeline trustworthy for everyone reviewing it.
Conclusion
To create a Gantt chart in ClickUp, build clear tasks, add realistic dates, organize the work, connect dependencies, mark milestones, and review the critical path. Then keep the timeline current as the project changes.
But here’s the truth: the visual chart is only useful when the plan behind it reflects real ownership, constraints, and handoffs. A weekly review helps you catch delays while they are still manageable.
If ClickUp no longer fits your project structure, ONES.com offers another route for project planning, Jira-compatible workflows, reporting, automation, and flexible deployment. Choose the system that makes your team’s next action clear.