How to Make a Gantt Chart in ClickUp: 7 Simple Steps (2026)
A Gantt chart can turn a complicated ClickUp project into a clear visual timeline. You can see when tasks begin, how long they last, and which deadlines depend on earlier work.
Still, creating one can feel confusing. A few incorrect dates, missing dependencies, or poorly grouped tasks can make your timeline misleading. Then your team spends more time fixing the chart than using it.
Here’s the good news: ClickUp makes the process manageable when you build the plan in the right order. This guide walks you through seven practical steps, from creating tasks to adjusting dependencies and sharing the final view.
How to Make a Gantt Chart in ClickUp: 7 Steps
To create a Gantt chart in ClickUp, build your tasks, add start and due dates, connect dependencies, open a Gantt view, and adjust the timeline. You can then group tasks, track progress, and share the plan with your team.
Here’s why the order matters: a Gantt chart reflects your task information. If tasks lack dates or relationships, the chart cannot show a reliable project schedule.
1. Create a ClickUp Workspace and Project Structure
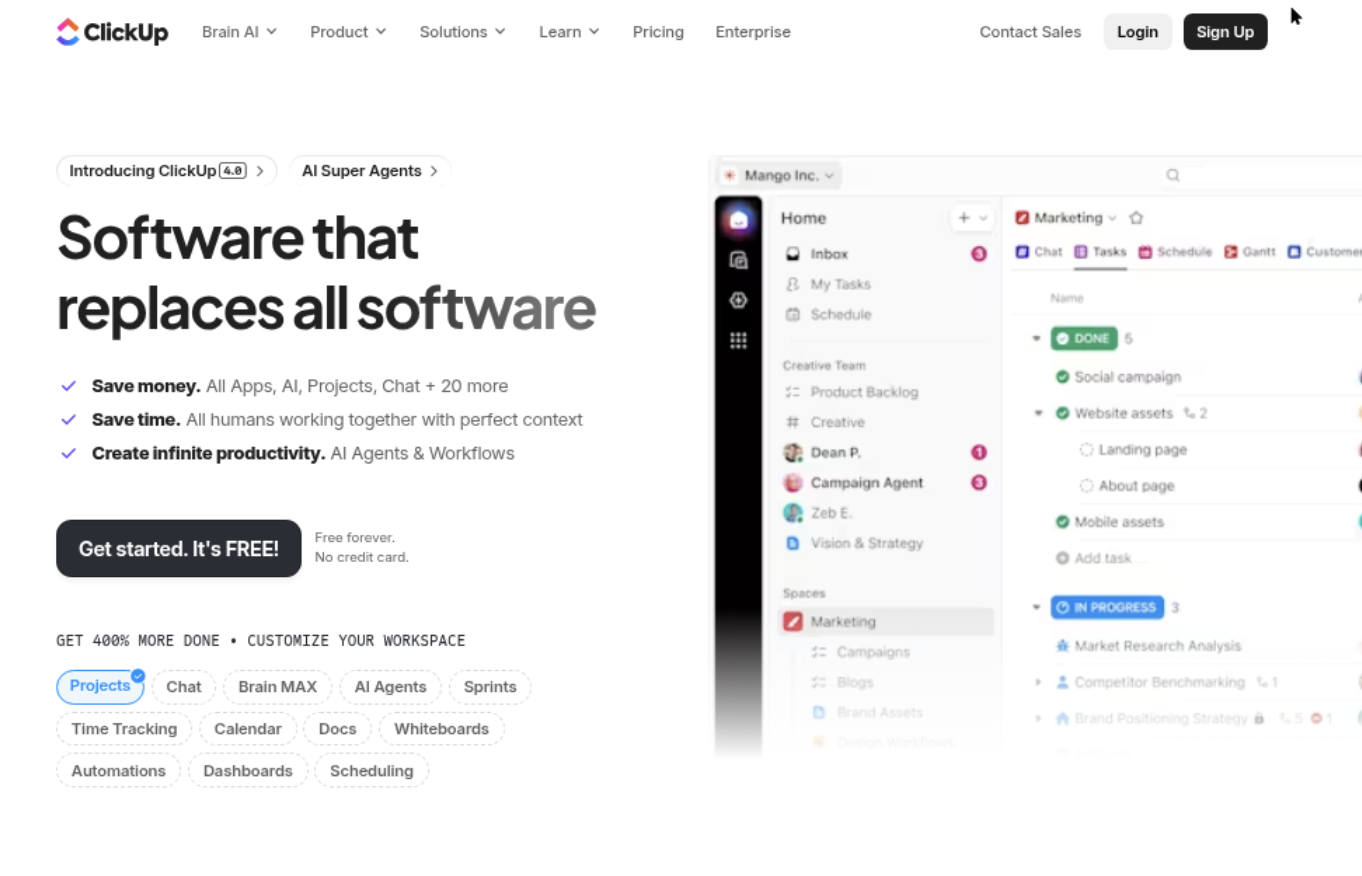
Start by opening the Space, Folder, or List where you want to manage the project. Your choice depends on the project’s size and how your team organizes work.
- Use a dedicated Space for a large department or business function.
- Use a Folder for a major initiative with several workstreams.
- Use a List for a smaller project with one connected workflow.
For example, a website redesign might use a Folder called Website Redesign. Inside it, you could create Lists for research, design, development, and launch.
Keep the structure simple at first. Too many nested locations can make tasks harder to find and complicate reporting later.
2. Add Every Project Task
Next, add the work required to complete the project. Write each task as a clear action, such as “Approve homepage layout” or “Configure payment testing.”
Useful task names describe an outcome. “Marketing” is vague, while “Approve launch email copy” gives the team a specific result to produce.
Break large activities into manageable tasks. A task that takes several weeks may hide multiple steps, owners, and deadlines.
For a product launch, your task list might include:
- Define launch audience
- Write product messaging
- Design campaign assets
- Review legal requirements
- Schedule email campaign
- Publish launch announcement
At this stage, focus on completeness. You can refine timing and ownership after the full workload is visible.
3. Assign Owners and Add Task Details
Assign every task to a person or team. An unassigned task can appear on the timeline, yet nobody may feel responsible for moving it forward.
Add priority, tags, checklists, and custom fields when they help explain the work. For example, a “Launch risk” field could identify tasks that need extra attention.
Use task descriptions for context, acceptance criteria, or review notes. Keep the key information close to the task so your team can act without searching through multiple systems.
You might also add subtasks. For “Publish launch announcement,” subtasks could include final editing, link testing, approval, and publishing.
The Gantt view becomes more useful when every visible task has a clear owner and a defined outcome.
4. Add Start Dates and Due Dates
Open each task and add a start date and due date. These dates determine the length and position of the task bar in your Gantt chart.
Use realistic durations. If a design review usually takes three business days, avoid assigning one afternoon simply to make the schedule look shorter.
Consider these timing questions:
- When can the task begin?
- What work must happen first?
- How much focused effort does the task require?
- Will the owner be available during that period?
- Does another team need to approve the result?
Here’s a simple example:
| Task | Start date | Due date |
|---|---|---|
| Write campaign messaging | March 2 | March 5 |
| Design campaign assets | March 6 | March 12 |
| Approve campaign assets | March 13 | March 16 |
| Schedule campaign | March 17 | March 18 |
These dates show a basic sequence. You can make the relationship clearer by adding dependencies in the next step.
5. Connect Tasks with Dependencies
Dependencies show how one task affects another. In ClickUp, connect tasks when the next activity cannot reasonably begin until the earlier activity reaches a certain point.
For example, a campaign cannot be scheduled until the final campaign assets receive approval. Linking those tasks helps the timeline respond when the approval date changes.
Common dependency types include:
- Waiting on: A task cannot start until another task finishes.
- Blocking: A task prevents another task from moving forward.
- Related: Two tasks need coordination even when one does not strictly control the other.
Use dependencies selectively. Connecting every task can create a tangled schedule that hides the most important relationships.
Focus on milestones, handoffs, approvals, and technical prerequisites. Those relationships usually have the greatest impact on delivery dates.
6. Add a Gantt View in ClickUp
Once your tasks and dates are ready, add a Gantt view to the relevant Space, Folder, or List.
Open the view options, choose the Gantt view, and give it a recognizable name. For example, use “Q2 Product Launch Timeline” instead of a generic label.
Depending on your workspace setup, you can adjust the view to show:
- Tasks and subtasks
- Milestones
- Dependencies
- Assignees
- Progress indicators
- Task groupings
- Time ranges by day, week, month, or year
Collapse details when you need a high-level roadmap. Expand them when you are reviewing a short delivery window with the project team.
The best part? You can use the same project information for daily task management and executive timeline reviews.
7. Review, Update, and Share the Timeline
Review the Gantt chart before sharing it. Look for missing dates, overlapping work, unrealistic deadlines, and dependencies that do not reflect the actual workflow.
Check the critical path first. If one delayed approval could move the entire launch, make that risk visible to the people who can reduce it.
Then share the view with the relevant team members. Explain how often they should update task progress and where they should raise schedule risks.
A Gantt chart only stays accurate when people maintain the underlying tasks. Add a short review to your weekly project meeting, or inspect the timeline after major changes.
For example, if testing takes two extra days, update the testing task and review every dependent activity. The chart should help you see the impact before the deadline arrives.
What to Prepare Before Building the Timeline
A Gantt chart works best when you understand the project before arranging the bars. Spend a few minutes defining the outcome, boundaries, milestones, and decision-makers.
Start with the final result. “Launch the customer portal to 500 beta users” gives the team more direction than “work on portal.”
Then identify the major stages. A software rollout could include planning, design, development, quality assurance, training, and release.
Here’s why: each stage gives you a natural way to group tasks. Without those groups, the chart may become a long list that is difficult to scan.
You should also identify fixed dates. Examples include a trade show, contract deadline, public announcement, or regulatory review.
Fixed dates help you work backward. If the product must launch on June 30, you can estimate the latest practical date for testing, training, and final approval.
How to Organize Tasks for Better Readability
A useful Gantt chart shows the right level of detail. Too little detail hides risk, while too much detail creates visual noise.
Use parent tasks for major phases and subtasks for the work inside each phase. A parent task called “Quality assurance” might contain test planning, test execution, defect review, and final sign-off.
Group similar tasks together. You could group by project phase, department, product area, or delivery milestone.
Choose one grouping method that matches the conversation your team needs. A leadership review may favor project phases, while a team planning session may favor responsible departments.
Use Milestones for Important Checkpoints
Milestones represent meaningful events rather than long periods of work. Examples include design approved, beta release complete, or customer training finished.
Use milestones sparingly. If every task appears as a milestone, the important checkpoints lose their visual impact.
A strong milestone usually answers one question: “What must be true before we can move forward?”
Separate Planning Work from Execution Work
Planning tasks often include scope definition, estimates, approvals, and scheduling. Execution tasks produce the actual deliverables.
Keeping these categories visible helps explain delays. A launch may slip because production work is slow, or because approval took longer than expected.
That distinction gives you a more useful project conversation. You can address the real constraint instead of simply asking everyone to work faster.
How Dependencies Improve ClickUp Project Scheduling
Dependencies create cause-and-effect relationships between tasks. They help you understand what changes when one activity moves.
Imagine a mobile app release. The testing team cannot begin full regression testing until the development team delivers a stable build. If the build slips, the testing window must also move.
Without a dependency, someone may notice the problem only after the test deadline passes. With one, the schedule provides an earlier warning.
Let me explain with a simple chain:
- Finish payment integration.
- Run payment testing.
- Resolve high-priority defects.
- Approve release candidate.
- Publish the new payment experience.
Each step affects the next. The chain does not mean every task must happen one after another, though. Some activities can run in parallel when they do not depend on the same outcome.
Find Work That Can Run in Parallel
Parallel work shortens project duration when teams have enough capacity. For example, the copy team and design team might begin separate preparation tasks at the same time.
Make sure parallel activities truly have independent starting conditions. Otherwise, you may create rework when one team finishes before the other has provided essential information.
Protect High-Risk Handoffs
Handoffs often create delays because responsibility changes between people or departments. Mark these relationships clearly in the timeline.
For example, a marketing team may wait for legal approval, while the engineering team may wait for security testing. These handoffs deserve realistic buffers and clear ownership.
How to Track Progress in a ClickUp Gantt Chart
A timeline is useful during planning, yet it becomes more valuable when it reflects actual progress.
Update task status as work changes. Use statuses such as planned, active, waiting for review, blocked, and complete when they match your workflow.
Track progress through meaningful outcomes. A task marked 80 percent complete should have a clear reason behind that estimate.
For example, “Design campaign assets” might be 80 percent complete because four of five assets passed review. That is more informative than a vague progress number.
You might be wondering: how often should you update the chart?
Update it whenever a major date changes, a dependency becomes blocked, or a milestone moves. For stable projects, a weekly review may be enough. For active launches, daily updates can prevent surprises.
Use Statuses to Explain Schedule Conditions
Dates tell you when work should happen. Statuses explain what is happening now.
A task due Friday may be on schedule, at risk, blocked, or already complete. Combining dates with statuses gives your team better context.
A blocked status should include a short explanation. “Waiting for security review” helps people understand the problem faster than “Blocked” alone.
Review Slippage Without Blame
When tasks move, investigate the reason. The cause may be unclear requirements, limited capacity, late approval, or a new priority.
Use that information to improve the next plan. A repeated two-day approval delay may justify earlier review dates in future projects.
The goal is visibility. A Gantt chart should help you respond to schedule changes while there is still time to act.
Common Gantt Chart Mistakes in ClickUp
Even a well-configured view can become unhelpful when the underlying planning habits are weak.
Adding Dates Without Understanding the Work
Assigning dates before clarifying tasks creates false precision. A bar on a timeline may look organized while the team still lacks a shared understanding of the outcome.
Define the work first. Then estimate duration and place it on the schedule.
Making Every Task Dependent
Too many dependencies create a rigid plan. A small change can then move a long chain of activities, even when some work could continue independently.
Connect tasks when a real constraint exists. Leave flexible relationships unlinked, and explain coordination needs through comments or task details.
Ignoring Capacity
A timeline may show ten tasks during one week for the same person. That schedule is unlikely to hold unless the tasks are small or intentionally overlapping.
Compare planned work with each owner’s availability. Include meetings, support duties, holidays, and other commitments when estimating realistic capacity.
Using the Chart as a One-Time Plan
A Gantt chart loses value when it remains unchanged after project conditions shift.
Review it during regular project discussions. Update dates, dependencies, statuses, and milestones as the team learns more.
A ClickUp Gantt Chart Alternative: ONES.com

Value Proposition
ONES.com combines project management and knowledge management in one platform powered by ONES Assistant. ONES Project provides project planning, timeline management, reporting, and Jira-compatible workflows.
It can suit teams that want a Jira alternative with native project features, fewer plugins, and deployment choices that include on-premise environments.
Core Capabilities
Separate timeline planning across project work
Pain: Teams often manage tasks in one place and long-term schedules somewhere else.
ONES capability: ONES Project brings task management, sprint planning, dependencies, and timeline planning into the same project environment.
Result: You can connect daily execution with larger delivery dates without rebuilding the schedule manually.
Jira-compatible workflows for familiar project operations
Pain: Teams moving away from Jira may worry about changing established processes.
ONES capability: ONES Project supports Jira-compatible workflows, custom workflows, and custom fields.
Result: Your team can preserve familiar approval paths while adapting the workspace to its own project rules.
Custom fields for schedule risk and planning context
Pain: Standard task fields may not capture launch risk, customer impact, release type, or approval status.
ONES capability: Custom fields let you add planning information that matches your delivery process.
Result: Project views and reports can show the factors that influence schedule decisions.
Built-in reporting for project visibility
Pain: Managers may need to collect progress updates manually before every review.
ONES capability: Built-in reporting helps present workload, progress, status, and project performance within the platform.
Result: You can spend less time preparing status summaries and more time resolving delivery risks.
Automation for repetitive project actions
Pain: Repeated updates, assignments, and status changes consume attention during busy projects.
ONES capability: Automation can support recurring project actions and workflow transitions.
Result: Routine work becomes more consistent, reducing the chance of missed handoffs or stale statuses.
Sprint management for agile delivery
Pain: A traditional timeline may not explain how a team organizes short development cycles.
ONES capability: ONES Project includes sprint management alongside broader project planning.
Result: Agile teams can connect sprint execution with milestones and longer delivery goals.
Knowledge management through ONES Wiki
Pain: Project decisions and working guidance often become separated from delivery activities.
ONES capability: ONES Wiki provides a knowledge management environment that can be purchased separately from ONES Project.
Result: Teams can keep planning guidance, procedures, and project knowledge accessible alongside their work management system.
Flexible deployment for restricted environments
Pain: Some organizations cannot place project information in a public cloud environment.
ONES capability: ONES.com supports Cloud, On-Premise, Private Cloud, and Air-gapped deployments. The self-hosted version offers feature parity with the cloud version.
Result: Teams can choose a deployment model that matches their security, compliance, and infrastructure requirements.
Application Scenarios
Software release planning: A development team can manage sprints, dependencies, custom release fields, and approval workflows in ONES Project. A timeline can show how engineering work connects to testing and launch milestones.
Enterprise transformation: A program team can organize several workstreams, use built-in reporting for leadership reviews, and connect shared guidance through ONES Wiki.
Restricted-network delivery: A team handling sensitive work can choose an on-premise or air-gapped deployment while retaining the core capabilities available in the cloud environment.
ONES.com offers a free plan for up to 30 seats. ONES Project and ONES Wiki are sold separately, so you can choose the product that matches your immediate needs.
Common Challenges When Creating a Gantt Chart
Challenge: The timeline contains too many tasks
Solution: Keep the main view focused on milestones, parent tasks, and schedule-driving work. Move detailed checklists into subtasks or task descriptions.
This gives leaders a readable roadmap while preserving detail for the people doing the work.
Challenge: Dates keep changing
Solution: Identify why dates move. If the cause is unclear scope, add an earlier planning checkpoint. If the cause is approval time, assign an owner and create a visible review task.
Frequent changes may indicate a planning problem rather than a scheduling problem.
Challenge: Team members forget to update tasks
Solution: Define a simple update routine. Ask owners to change status, adjust dates, and add a short note when work becomes blocked.
Use the same routine in every project meeting. Consistency makes updates easier to remember.
Challenge: Dependencies create confusion
Solution: Explain why each important dependency exists. A team member should understand what they are waiting for and what action will release the next task.
Remove relationships that no longer reflect the actual workflow.
Challenge: The chart does not reflect team capacity
Solution: Review each owner’s workload before committing to dates. Reduce simultaneous work when one person carries several schedule-critical tasks.
Shorter task queues often improve delivery speed because people spend less time switching between activities.
FAQs About Creating a Gantt Chart in ClickUp
Can I create a Gantt chart in ClickUp without building a separate project plan?
Yes, you can create a Gantt view inside an existing ClickUp Space, Folder, or List. However, the view becomes useful only when tasks have clear names, owners, dates, and relationships. Start with a basic task plan, then add the Gantt view. You can refine groups, milestones, and dependencies after seeing the schedule visually.
What should I include in a ClickUp Gantt chart?
Include tasks that affect project timing, such as major activities, approvals, handoffs, milestones, and delivery work. Add owners, start dates, due dates, statuses, and important dependencies. Keep minor checklist items out of the main timeline when they create clutter. Place that detail inside subtasks or task descriptions.
How many dependencies should a Gantt chart have?
Use enough dependencies to show genuine constraints. Focus on tasks that must wait for approvals, technical prerequisites, reviews, or handoffs. Avoid linking every activity simply because it appears in sequence. A dependency should explain a real cause-and-effect relationship. Review each link when the workflow changes.
Can a Gantt chart show tasks that happen at the same time?
Yes. Tasks with different requirements can run in parallel, so their bars can overlap. For example, a marketing team can prepare launch messaging while engineers complete a separate technical task. Confirm that the work truly has independent starting conditions. Parallel scheduling can shorten delivery time, although it may increase coordination needs.
How often should I update the timeline?
Update it whenever a milestone, dependency, owner, or important date changes. A weekly review works for stable projects. Active launches may need daily updates. Ask owners to update status and dates before the review. That gives you a current view of risks and keeps the meeting focused on decisions.
Is ONES.com suitable for teams seeking a ClickUp or Jira alternative?
ONES.com can suit teams looking for unified project and knowledge management. ONES Project supports project planning, custom workflows, sprint management, automation, reporting, and Jira-compatible workflows. ONES Wiki is available separately for knowledge management. Deployment options include Cloud, On-Premise, Private Cloud, and Air-gapped environments, with feature parity between cloud and self-hosted versions.
Conclusion
Creating a Gantt chart in ClickUp starts with a reliable task plan. Add clear work, assign owners, set realistic dates, connect meaningful dependencies, and review the timeline regularly.
But here’s the truth: a polished chart cannot repair unclear scope or unrealistic capacity. The schedule becomes valuable when it reflects how your team actually works.
Use milestones to show major checkpoints, statuses to explain current conditions, and dependencies to reveal schedule risks. If your team needs broader project and knowledge management, ONES.com offers ONES Project and ONES Wiki as separate products.
Start with one project, keep the first timeline focused, and improve it during every review. That approach turns a Gantt chart from a static picture into a practical planning tool.