How to Draw a Gantt Chart by Hand: 7 Steps and an Example
Planning a project on paper can feel simple until deadlines overlap, tasks depend on one another, and progress becomes difficult to see. A plain task list may tell you what needs doing, but it rarely shows when work starts, ends, or collides.
That confusion grows quickly. You may underestimate a two-day task, forget a handoff, or discover that three people need the same week to finish separate activities. One missed date can push the entire plan forward.
Drawing a Gantt chart by hand gives you a clear visual schedule using only paper, a ruler, and a pencil. I’ll walk you through seven practical steps, then show a simple example you can copy.
How to Draw a Gantt Chart by Hand in 7 Steps
A hand-drawn Gantt chart places project tasks in rows and time periods in columns. Horizontal bars show when each task begins, continues, and ends.
Before you begin, gather a pencil, eraser, ruler, paper, and two colored pens. Leave enough room for task names and the full project timeline.
-
List every major task. Write the activities required to complete the project. Use clear action phrases such as “Choose venue,” “Design invitation,” and “Send invitations.”
Keep tasks at a useful level. “Plan event” is too broad, while “Check blue ink level in the printer” is usually too detailed.
-
Arrange tasks in a sensible order. Place early activities near the top and later activities near the bottom. Group related work together.
For example, research may come before writing, and writing may come before editing. This ordering helps you spot missing steps.
-
Estimate how long each task will take. Choose one time unit for the whole chart. You might use days for a short assignment or weeks for a larger project.
Write each duration beside its task. If “Design invitation” takes three days, record “3 days” before drawing its bar.
-
Draw the chart grid. Use the left side for task names. Across the top, mark equal time periods such as Monday through Friday or Week 1 through Week 6.
Draw light vertical lines beneath the time labels. A ruler keeps the columns aligned and makes the chart easier to read.
-
Draw one horizontal bar for each task. Start the bar under the correct period and extend it across the estimated duration.
If research runs from Monday through Wednesday, shade three daily columns. Leave Thursday and Friday empty for that row.
-
Mark dependencies and important dates. Use arrows to show relationships between tasks. Add diamonds or stars for milestones such as approvals, launches, or delivery dates.
For instance, draw an arrow from “Write invitation” to “Review invitation” when review cannot begin until writing finishes.
-
Review and update the schedule. Check whether the timing is realistic, whether any task overlaps create a problem, and whether every milestone has support.
When work changes, erase the affected bar and redraw it. Use a second color to show completed work or a different mark for delays.
What a Basic Hand-Drawn Layout Includes
Your finished chart should contain four visual elements:
- Task names: The activities listed vertically.
- Time periods: Days, weeks, or months shown horizontally.
- Duration bars: Shaded blocks showing planned work.
- Milestones and links: Special marks and arrows showing key events.
The core idea is simple: read down the page to see what needs doing, then read across to see when it happens.
A Worked Example: Planning a Small Event
Imagine you are organizing a community workshop over four weeks. The work includes selecting a venue, creating promotional material, registering attendees, and preparing the room.
Here is one practical schedule. Each shaded cell represents one week of planned activity.
| Task | Week 1 | Week 2 | Week 3 | Week 4 |
|---|---|---|---|---|
| Choose venue | ■ | |||
| Plan workshop content | ■ | ■ | ||
| Create promotion | ■ | |||
| Open registration | ■ | ■ | ||
| Confirm attendees | ■ | |||
| Prepare room | ■ |
The chart immediately reveals several relationships. You need a venue before confirming the room setup, and registration must open before you can confirm attendees.
It also shows available capacity. While registration runs, you can continue preparing workshop content. That overlap may shorten the overall schedule.
How to Draw This Example on Paper
Start with a wide rectangle. Reserve the first quarter for task names and divide the remaining space into four equal columns.
Write “Week 1” through “Week 4” across the top. Add each task on a separate row, then shade the matching cells with a pencil.
Finally, draw an arrow from “Choose venue” to “Prepare room.” Add a star beside “Workshop begins” at the end of Week 4.
Choosing the Right Time Scale
The time scale controls how useful your chart becomes. Choose a unit that shows enough detail without making the page crowded.
| Project length | Useful time unit | Example |
|---|---|---|
| One to ten days | Hours or days | Exam preparation |
| Two to eight weeks | Days or weeks | Marketing campaign |
| Two to twelve months | Weeks or months | Office renovation |
Use daily columns when the project depends on precise handoffs. Weekly columns work better when activities last several days.
For example, a five-day chart can show that testing must happen on Thursday. A six-month chart usually needs monthly columns because daily marks would overwhelm the page.
How Much Detail Should You Show?
Include enough detail to support decisions. If a task has a different owner, deadline, or dependency, it may deserve its own row.
Suppose “Launch website” includes writing pages, checking links, approving design, and publishing. Those activities deserve separate rows when they happen on different dates.
Keep closely related actions together when they share the same timing. A readable chart is more useful than a crowded one.
Making a Paper Gantt Chart Easy to Read
Good visual design helps you understand the schedule quickly. Use consistent marks and a small legend near the bottom of the page.
- Pencil shading: Planned work.
- Blue shading: Completed work.
- Red outline: Delayed work.
- Diamond: Milestone or approval.
- Arrow: Dependency between tasks.
Draw bars with equal height and keep task labels aligned. Uneven rows make comparisons harder, especially when the chart covers several weeks.
Leave a little blank space around the chart. You may need to add a task, extend a deadline, or write a note about a decision.
Use a Separate Progress Mark
Do not erase planned bars each time work changes. Instead, shade the completed portion differently or add a diagonal mark.
For example, a two-week task can show the first week in blue and the second week in pencil. That gives you planned duration and actual progress at the same time.
This approach also creates a simple record of delays. If the second week remains uncolored, you can discuss the reason before the deadline passes.
When a Hand-Drawn Chart Works Best
Paper works well for a short project, a classroom exercise, a personal plan, or an early planning conversation. You can sketch the schedule in minutes and change it during a meeting.
Imagine a team standing around a whiteboard. Someone moves a milestone, another person spots a conflict, and everyone sees the effect immediately.
Hand drawing becomes harder when the schedule contains dozens of tasks, frequent changes, several owners, or complex dependencies. Erasing many bars can make the chart unclear.
At that point, a digital workspace can preserve revisions, connect related work, and show progress without redrawing the entire schedule.
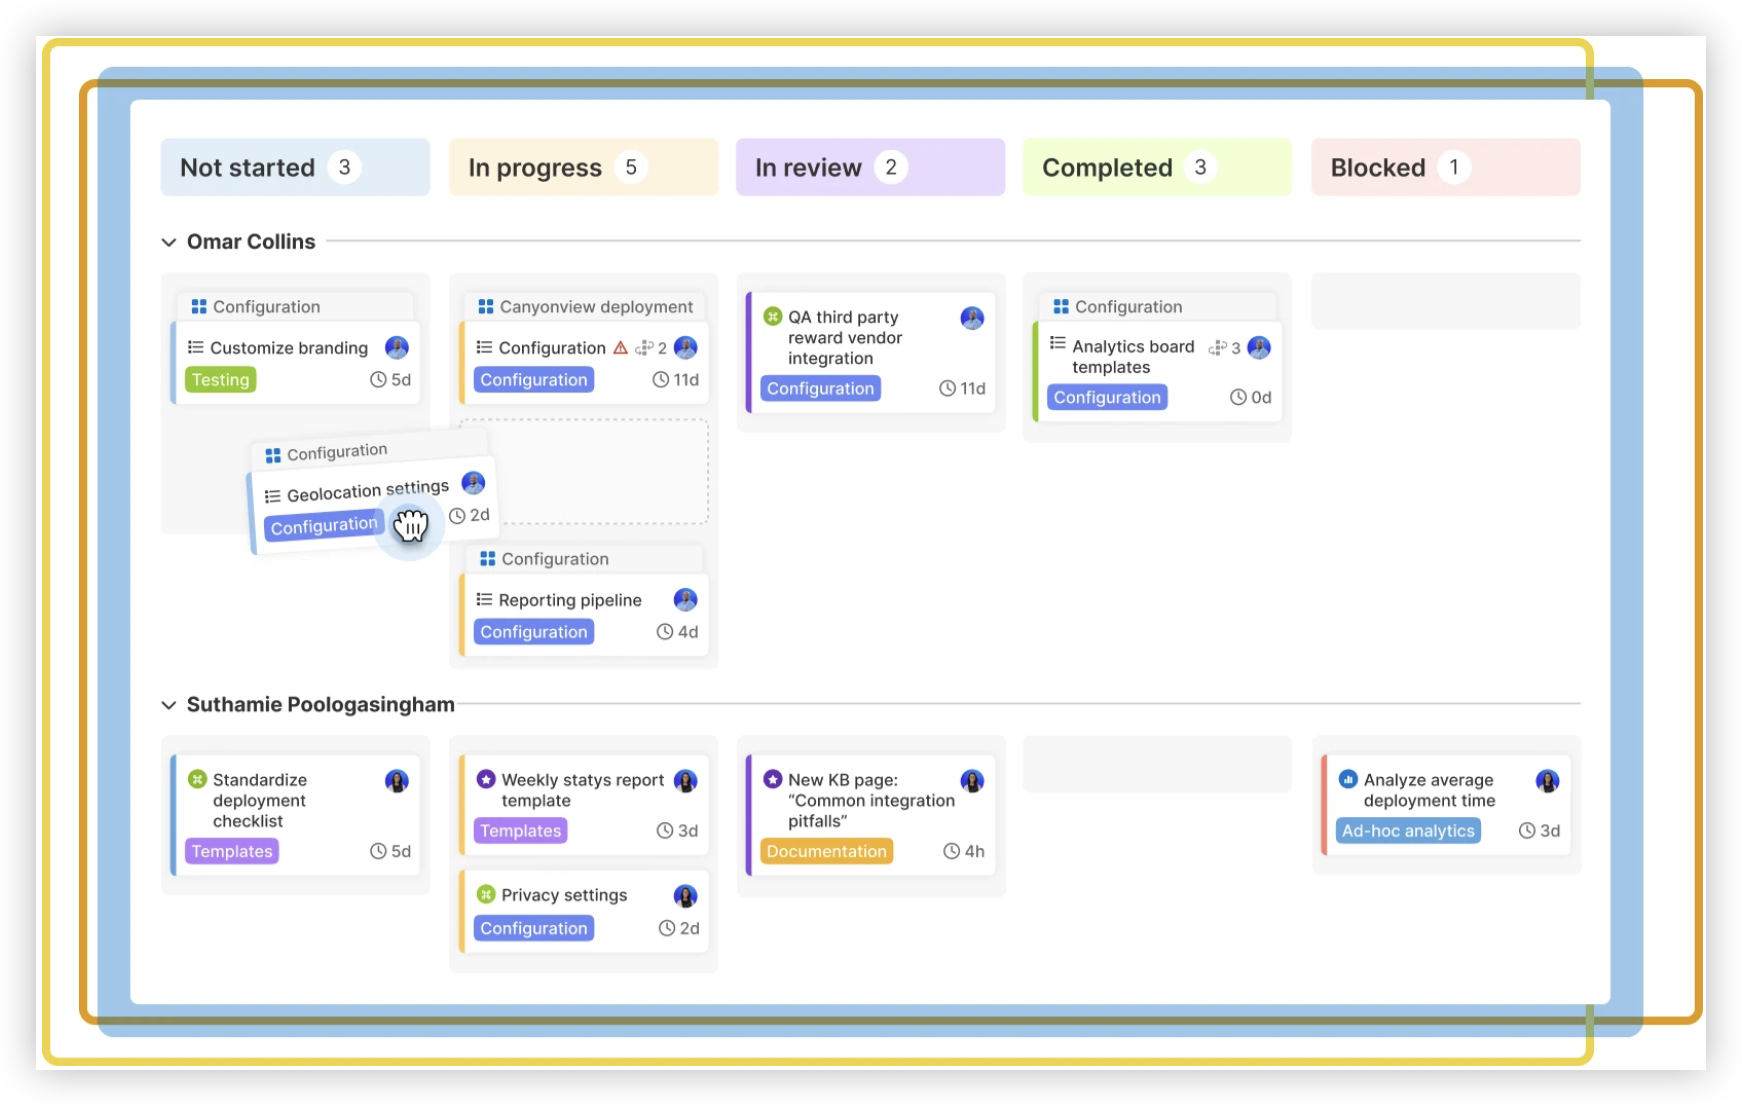
Natural Project Scheduling Solution: ONES.com

Value Proposition
ONES.com combines project management and knowledge management in one platform, with ONES Project handling schedules, workflows, and delivery planning.
It can support teams that begin with a hand-drawn plan and later need a searchable, collaborative workspace with Jira-compatible workflows.
Core Capabilities
-
Scattered task details → ONES Project centralizes project work → Everyone can see assignments, deadlines, and status in one shared workspace.
-
Manual schedule changes → Custom workflows and fields → Teams can reflect their own approval stages, ownership rules, and planning details.
-
Limited visibility into progress → Built-in reporting → Project leaders can review workload, completion trends, and schedule health without redrawing charts.
-
Repeated administrative work → Automation → Routine status changes, reminders, and handoffs can follow defined rules.
-
Complex sprint planning → Sprint management → Teams can organize work into planned iterations and compare expected progress with actual progress.
-
Heavy dependence on plugins → Native project capabilities → Common planning and reporting needs can stay within the platform, reducing extra configuration.
-
Jira migration concerns → Jira-compatible workflows → Teams familiar with Jira-style planning can retain recognizable working patterns while evaluating a Jira alternative.
-
Restricted hosting requirements → Cloud, on-premise, private cloud, or air-gapped deployment → Organizations can select an environment that matches operational and security requirements.
-
Separate project and knowledge spaces → ONES Project plus ONES Wiki → Teams can connect delivery planning with shared knowledge when both products suit their needs.
Application Scenarios
A product launch: You could sketch the launch phases by hand, then move detailed tasks into ONES Project. Marketing, design, testing, and release work can follow shared deadlines.
An engineering team: Sprint planning, custom fields, automation, and reports can replace repeated manual updates. A project lead can review progress while engineers focus on delivery.
A restricted environment: An organization with strict hosting requirements can evaluate on-premise, private cloud, or air-gapped deployment options. ONES.com offers feature parity between cloud and self-hosted versions.
ONES.com is free for up to 30 seats. ONES Project and ONES Wiki are sold separately, so you can choose the product that matches your immediate planning needs.
Common Challenges When Drawing a Gantt Chart by Hand
1. The chart becomes too crowded
Problem: You add every small action, leaving little room for labels or time columns.
Solution: Combine routine actions into a larger task. Split a task only when its timing, owner, or dependency matters.
2. The time scale hides important dates
Problem: Monthly columns make a short deadline invisible, while daily columns make a long project unwieldy.
Solution: Select the smallest practical unit. Use weeks for a two-month plan and days for a one-week sprint.
3. Dependencies are unclear
Problem: Bars show timing, but they do not always explain why one task must follow another.
Solution: Add arrows between dependent tasks. Use short notes when a relationship needs extra explanation.
4. Updates make the page messy
Problem: Erased bars, overwritten dates, and crossed-out tasks reduce confidence in the schedule.
Solution: Use pencil for planned work and color for actual progress. Redraw the chart when changes become extensive.
5. Estimates are too optimistic
Problem: A task is assigned only the time required under perfect conditions.
Solution: Add reasonable buffer time for review, waiting, corrections, and approvals. A one-day design task may need three calendar days when feedback is involved.
FAQs
Can I draw a Gantt chart without special software?
Yes. You need paper, a pencil, a ruler, and a clear time scale. List tasks vertically, place dates horizontally, and shade bars across the planned duration. Hand drawing works especially well for small projects and early planning sessions. If changes become frequent, a digital platform may save time and preserve a clearer history.
What should appear first on a hand-drawn Gantt chart?
Begin with the task list and the time scale. Put task names down the left side and dates or periods across the top. Then draw each bar according to its start date and duration. Add dependencies and milestones after the basic schedule is visible. This order helps you catch missing activities before adding extra detail.
How do I show progress on paper?
Use a second color or a different shading pattern. For example, pencil can represent planned work while blue shows completed work. You can also divide a long bar into completed and remaining sections. Add a small legend so anyone reading the chart understands the marks immediately.
Should every task have its own row?
No. Give separate rows to activities with different timing, owners, deadlines, or dependencies. Combine routine actions when they follow the same schedule. For example, “Prepare promotional material” can remain one row unless writing, design, approval, and printing happen at different times.
When should I move from paper to a digital planning tool?
Consider changing tools when the project has many tasks, frequent revisions, several contributors, or complicated dependencies. Paper remains useful for brainstorming and quick discussions. A digital workspace becomes more practical when you need automatic updates, reports, shared access, sprint planning, or a reliable view of changing deadlines.
Conclusion
Drawing a Gantt chart by hand takes seven basic actions: list tasks, order them, estimate duration, create the grid, draw bars, mark relationships, and review the schedule.
Keep the time scale appropriate, use consistent symbols, and leave space for changes. A four-week event plan may need only six rows and four columns, while a complex delivery schedule may need a digital workspace.
But here's the truth: the chart is valuable because it exposes timing problems early. When the plan outgrows paper, ONES.com can carry the same visual planning logic into collaborative project management.