How to Create a Gantt Chart in Smartsheet: 7 Easy Steps
Project plans can become confusing quickly when tasks, deadlines, dependencies, and assigned people sit in separate views. A simple list may show what needs doing, yet it rarely reveals how one delay affects the rest of the work.
That uncertainty creates missed handoffs, rushed approvals, and uncomfortable status meetings. You may spend more time explaining the plan than managing it. Even a small marketing launch can become difficult when five tasks depend on one unfinished design.
But here's the truth: Smartsheet can turn your task list into a visual timeline with only a few setup decisions. In this guide, I’ll show you how to create a Gantt chart in Smartsheet in seven practical steps, plus how to avoid common planning mistakes.
How to Create a Gantt Chart in Smartsheet: 7 Steps
A Gantt chart in Smartsheet is a visual project timeline that displays tasks, dates, durations, dependencies, and progress in horizontal bars. It helps you see when work starts, when it should finish, and how tasks connect.
Smartsheet can create a Gantt view from a sheet with properly configured task, date, duration, and dependency columns. You can begin with a blank sheet or choose a project template, then adjust the structure to match your workflow.
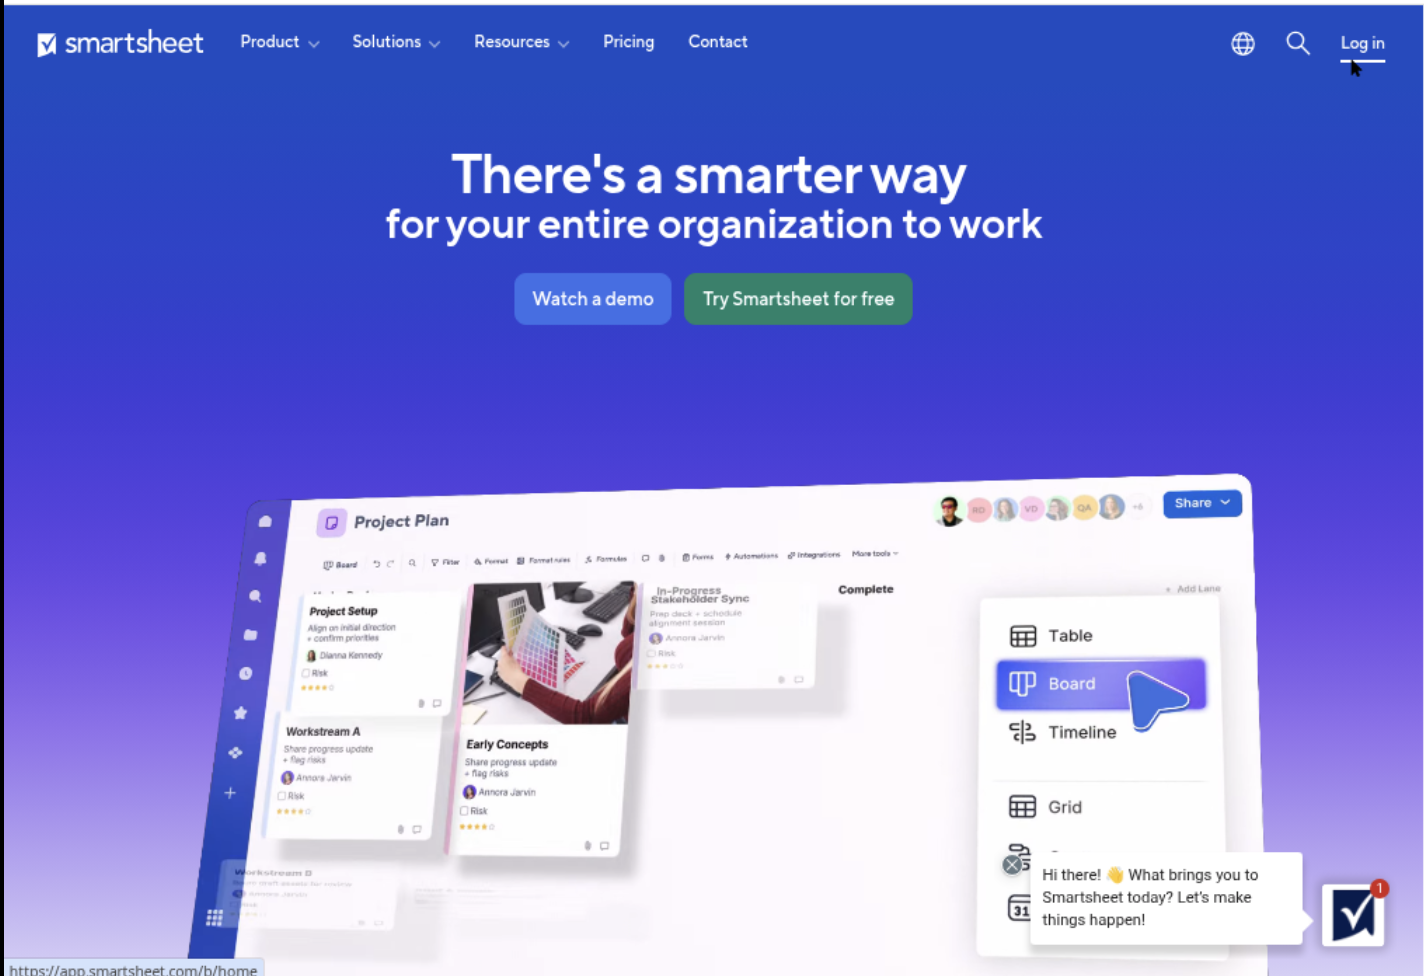
1. Start with a Project Sheet or Template
Sign in to Smartsheet and create a new sheet. You can start with a blank project sheet or select a template that already includes common planning columns.
For a simple project, a blank sheet often gives you more control. A product launch, for example, may need tasks for research, design, review, development, testing, and release.
Give the sheet a clear name, such as Website Relaunch Timeline. A specific name makes the plan easier to identify when your workspace contains several projects.
Here's why: the first structure you choose affects every later step. A clean task hierarchy makes the chart easier to read and reduces manual correction.
2. Add the Essential Task Columns
Set up columns that describe each activity and its timing. The most useful starting structure includes:
- Task Name: the activity the team needs to complete.
- Start Date: the planned beginning of the activity.
- End Date: the planned completion date.
- Duration: the amount of working time required.
- Predecessors: earlier tasks that control when another task can begin.
- Assigned To: the person or group responsible for the work.
- Status: a progress label such as Not Started, In Progress, or Complete.
Smartsheet may include some of these columns when you select a project template. Check each column type before entering information. Date columns should hold dates, while duration should use values such as 5d.
For example, a task called “Approve homepage design” might start on March 10, finish on March 12, and have a duration of three working days.
3. Enter Tasks in a Logical Order
List the work in the order it generally happens. You do not need perfect dates yet. Focus first on the project’s activities and major phases.
A website project could look like this:
- Confirm project goals
- Write page content
- Create wireframes
- Approve visual design
- Build the pages
- Run quality checks
- Publish the website
Use parent rows for phases and child rows for detailed activities when the project is complex. For example, “Design” can contain “Create wireframes,” “Prepare visual concepts,” and “Approve visual design.”
This hierarchy helps you review progress at two levels. A project lead can scan the major phases, while a contributor can see the exact task requiring attention.
4. Add Start Dates, End Dates, or Durations
Enter timing information for each task. Smartsheet can calculate part of the schedule when dependencies and project settings are configured correctly.
You may enter:
- A start date and end date.
- A start date and duration.
- An end date and duration.
For most projects, start date plus duration is an efficient approach. If “Write page content” begins on March 3 and takes five working days, Smartsheet can calculate the planned finish date.
Be careful with non-working days, holidays, and calendar settings. A task lasting five working days may cover seven calendar days when a weekend sits between the start and finish.
You might be wondering: should every task have an exact estimate? Aim for a useful estimate rather than false precision. “Two working days” is often more practical than “17 hours and 30 minutes.”
5. Turn on Dependencies
Dependencies show relationships between tasks. In Smartsheet, open the project settings and enable dependencies for the sheet. Confirm that your date and duration columns are mapped correctly.
The most common relationship is finish-to-start. This means one task must finish before the next task begins.
For example, “Approve visual design” may depend on “Create visual concepts.” If the approval takes longer than expected, the build phase can shift automatically when the dependency is configured.
Smartsheet also supports other relationship types for more advanced plans. Use them carefully. A complicated network of relationships can make a chart harder to maintain than a simpler sequence.
The best part? Dependencies reduce the need to manually change every later date after one schedule adjustment.
6. Switch to Gantt View
Once your tasks and timing are ready, select the Gantt view in Smartsheet. The task list will appear alongside a timeline, and each activity will display as a horizontal bar.
Review the chart from left to right. Look for:
- Bars that overlap when they should run in sequence.
- Large gaps between related activities.
- Tasks with no dates or durations.
- Dependencies pointing to the wrong activity.
- Milestones that appear too early or too late.
You can adjust the timeline scale to show days, weeks, months, or quarters. Use a daily view for a short event and a monthly view for a six-month implementation plan.
Let me explain: the Gantt view is valuable because it shows schedule shape. A task list tells you what exists; the timeline shows how the work behaves over time.
7. Add Milestones, Owners, and Progress
Finish the chart by adding milestones and progress information. A milestone marks an important point, such as approval, launch, testing completion, or a customer handoff.
Milestones usually have no meaningful duration. Create a separate row for each milestone and use a duration of zero days when appropriate.
Add owners so each task has clear accountability. Then update status or percentage complete during project reviews.
For example, a weekly review may reveal that:
- Content writing is 100% complete.
- Design approval is 60% complete.
- Development has not started because approval is pending.
That information gives you a practical conversation starter. You can discuss the blocked approval instead of asking for a broad status update.
How to Structure the Sheet Before Building the Timeline
A Gantt chart becomes useful when the underlying plan reflects real work. Start with deliverables, divide them into manageable activities, and identify the relationships that control timing.
Use Phases to Organize Larger Projects
Group related tasks under phases such as Planning, Design, Build, Testing, and Launch. Keep each phase focused on a recognizable outcome.
For instance, “Testing” could include browser checks, accessibility review, performance testing, and final approval. This gives you enough detail to manage progress without turning the chart into hundreds of tiny rows.
Choose the Right Level of Detail
A task should usually represent work that one person or one small group can complete within a reasonable period. “Build the product” is too broad for most plans. “Create account registration screen” is easier to estimate and track.
At the same time, avoid breaking work into every minor action. A plan with 400 rows may look thorough, yet important risks can disappear among low-value details.
Separate Tasks from Milestones
A task consumes time. A milestone represents an event or decision. Keeping them separate makes the timeline easier to interpret.
“Complete legal review” may take three days. “Legal approval received” is the milestone that confirms the work is ready for the next phase.
How Dependencies Affect Your Smartsheet Timeline
Dependencies connect schedule logic. They help explain why a later activity moves when an earlier activity changes.
Consider a mobile app release. Testing may depend on a completed build, and the public release may depend on testing approval. If the build slips by four days, the connected activities may move as well.
Common Dependency Relationships
Finish-to-start is the relationship you will use most often. The first activity finishes, then the next begins.
Start-to-start allows two activities to begin together or close together. For example, technical writing may start when development begins.
Finish-to-finish links the completion of two activities. A review task may need to finish at the same time as a testing cycle.
Start-to-finish is less common. It applies when one activity cannot finish until another begins, such as an old support process ending when a replacement process starts.
Use Dependencies for Real Constraints
Do not connect every task simply because they appear in the same phase. A dependency should represent a real timing relationship.
If design and content can progress independently, allow them to overlap. If development truly requires approved design, connect those activities.
This approach creates a more realistic plan and may shorten the overall timeline through parallel work.
How to Make the Chart Easy to Read
A crowded timeline can hide the information you need. A few formatting and review habits can make the chart easier to understand during meetings.
Use Consistent Task Names
Start task names with clear action words, such as “Review contract,” “Prepare test environment,” or “Publish release notes.” Consistent wording makes scanning faster.
Avoid vague labels like “Follow up” or “Fix things.” Those labels provide little guidance when the task becomes overdue.
Keep Status Values Consistent
Choose a small set of status values and use them throughout the project. A practical set includes Not Started, In Progress, Blocked, Complete, and Canceled.
If one person uses “Finished” and another uses “Complete,” reporting becomes harder. Consistent labels make filtering and summaries more reliable.
Highlight Risks and Blocked Work
Use symbols, colors, or a dedicated risk column to identify blocked activities. For example, a task awaiting customer approval may need a different visual treatment than a task progressing normally.
Keep the reason specific. “Waiting for brand approval” is more useful than “Delayed.” It tells you what action may remove the obstacle.
How to Maintain the Schedule After Creation
Creating the chart is only the beginning. A Gantt timeline remains useful when the plan reflects current conditions.
Review It on a Regular Cadence
For an active project, review the schedule weekly. High-risk launches may require a short review every day during the final stage.
During each review, ask:
- Which activities finished since the last review?
- Which activities are behind schedule?
- Which upcoming task depends on a delayed activity?
- Has the scope changed?
- Does the plan need a new owner or estimate?
Update Actual Progress, Not Just Planned Dates
Moving a planned date to hide a delay can make the chart look healthy while reducing its value. Track progress honestly and record the reason for major changes.
For example, if testing was planned for March 18 but starts on March 22, preserve the context. That history can improve estimates for the next project.
Use Baselines When You Need a Plan-versus-Reality View
A baseline captures the original schedule so you can compare it with current progress. This is helpful when stakeholders need to understand how the timeline changed.
Suppose the original launch date was June 1, but a supplier delay moved it to June 12. A baseline makes the schedule impact visible without relying on memory.
A Practical Gantt Chart Alternative: ONES.com
ONES.com combines project management and knowledge management in one platform powered by ONES Assistant. ONES Project provides project planning capabilities and works as a Jira alternative, while ONES Wiki supports team knowledge management. They are sold separately.

If your team needs a Gantt-style planning workflow with custom processes, reporting, and deployment flexibility, ONES.com can provide a broader project environment than a standalone timeline. It supports Cloud, On-Premise, Private Cloud, and Air-gapped deployments, with feature parity between cloud and self-hosted versions.
Value Proposition
ONES.com helps teams connect structured project execution with shared knowledge. You can manage schedules, workflows, and reporting while keeping project context accessible in the same platform family.
Core Capabilities
- Disconnected project information: Teams may keep plans and knowledge in separate places. ONES capability: ONES.com brings project management and knowledge management into one platform family. Result: People can find planning context and team guidance with less switching.
- Rigid task processes: A fixed workflow may fail to match approval-heavy work. ONES capability: ONES Project supports custom workflows and fields. Result: You can reflect stages such as Design Review, Security Approval, and Release Readiness.
- Limited planning control: Basic task lists may not represent sprints or dependencies clearly. ONES capability: ONES Project includes sprint management and Jira-compatible workflows. Result: Agile teams can adapt familiar planning practices within a broader platform.
- Manual repetitive actions: Teams may spend time updating routine statuses or triggering follow-up work. ONES capability: Automation supports recurring workflow actions. Result: Routine transitions require less manual coordination.
- Scattered reporting: A team may struggle to understand progress across projects. ONES capability: Built-in reporting provides project visibility. Result: Managers can review progress, workload, and delivery signals more consistently.
- Plugin-heavy project setups: Multiple add-ons can increase maintenance work. ONES capability: Native project features reduce reliance on separate plugins for core workflows. Result: Administrators can manage a simpler environment.
- Restricted-network requirements: Some organizations cannot place project information in a public cloud environment. ONES capability: ONES.com supports On-Premise, Private Cloud, and Air-gapped deployments. Result: Teams can choose an environment that fits their security requirements.
- Growth beyond a small project: A planning approach may need to support more people and complex work. ONES capability: The free plan supports up to 30 seats. Result: A small team can evaluate core project workflows before expanding its operating model.
Application Scenarios
Software release planning: A development team can organize epics, sprints, testing, approvals, and release activities. Custom fields can capture risk, environment, or release status alongside each work item.
Regulated or restricted environments: A team working in an air-gapped setting can use a self-hosted deployment while maintaining project workflows and reporting capabilities.
Cross-functional launches: Marketing, product, design, and engineering can coordinate launch activities through shared workflows while retaining useful project knowledge for future planning.
Common Challenges and Practical Fixes
Challenge: Dates Keep Moving Unexpectedly
Cause: Dependencies, working calendars, or task estimates may be configured incorrectly.
Solution: Check the dependency settings, review non-working days, and confirm whether each duration represents working days or calendar days. Test one short sequence before building the entire schedule.
Challenge: The Chart Contains Too Many Tasks
Cause: Every small action has been added as a separate row.
Solution: Combine minor actions into a meaningful deliverable. Keep detailed notes elsewhere in the project workspace and reserve the timeline for activities that affect timing or accountability.
Challenge: Several People Own the Same Activity
Cause: Shared responsibility has replaced clear accountability.
Solution: Assign one primary owner and list supporting contributors in a separate field or team note. A single accountable person makes follow-up clearer.
Challenge: The Plan Looks Complete but Work Is Blocked
Cause: Status shows progress without showing external approvals, missing access, or unresolved decisions.
Solution: Add a Blocked status and a short blocker explanation. Link the blocked activity to the decision or approval that can release it.
FAQs
Can I create a Gantt chart in Smartsheet without a template?
Yes. Create a blank sheet, then add task, start date, end date, duration, and predecessor columns. Enable dependencies in the project settings and switch to Gantt view. A template can save setup time, yet a blank sheet may work better when your project has unusual phases or custom tracking needs.
What columns are required for a Smartsheet Gantt chart?
You need a task column and date information. A start date and end date are enough for a basic timeline. Adding duration and predecessor columns gives you better schedule control. Owner, status, milestone, and risk columns improve team coordination but are optional for the initial chart.
How do dependencies change the timeline?
Dependencies connect tasks that have a timing relationship. When an earlier activity shifts, a connected later activity may move as well. This helps you see schedule impact without manually adjusting every date. Review each relationship carefully, because an incorrect dependency can create unnecessary delays.
Should I use a Gantt chart for an Agile project?
Yes, when you need a higher-level view of releases, milestones, dependencies, or cross-team coordination. A Gantt chart can complement sprint boards by showing how several iterations support a larger outcome. Keep sprint-level work in the team’s normal workflow and use the timeline for broader planning.
How often should I update the chart?
Update it at least weekly for an active project. Review it more often during a launch, migration, or period with many dependencies. Record meaningful changes to dates, owners, scope, and blockers. Frequent small updates usually require less effort than reconstructing the schedule after a major delay.
Is ONES.com suitable for teams that need more than a timeline?
ONES.com may suit teams that need project management, custom workflows, reporting, sprint management, automation, and knowledge management within one platform family. ONES Project is positioned as a Jira alternative and supports Cloud, On-Premise, Private Cloud, and Air-gapped deployments. Evaluate the workflow, deployment, and collaboration requirements before choosing a platform.
Conclusion
Creating a Gantt chart in Smartsheet involves seven practical actions: start a project sheet, add essential columns, enter tasks, define timing, enable dependencies, open Gantt view, and maintain progress.
The strongest charts are clear enough to scan and detailed enough to guide decisions. Use phases, realistic estimates, meaningful dependencies, named owners, and visible blockers.
But here's the truth: a timeline only helps when you keep it current. If the schedule reflects real progress, you can spot risks earlier and explain delays with greater confidence.
For teams that need a wider project environment, ONES.com offers ONES Project for project management, reporting, workflows, sprint planning, automation, and flexible deployment options. Choose the approach that matches the size, complexity, and security needs of your work.