How to Create a Gantt Chart in Confluence: 7 Easy Steps
A Gantt chart can turn a confusing Confluence project page into a clear timeline. Without one, deadlines hide inside scattered task lists, dependencies stay unclear, and small delays can quickly affect the launch date.
That confusion becomes costly when several people update plans in different places. You may spend more time asking for status updates than moving the project forward. Confluence can help, but it does not provide a full native Gantt experience in every setup.
Here’s the practical solution: prepare your project details, choose a chart method, add the timeline to a Confluence page, and maintain it through the project. The seven steps below show exactly how to do that.
How to Create a Gantt Chart in Confluence: 7 Steps
The quickest approach is to use a Confluence Gantt app or an approved chart integration. You can also build a simple timeline with a Confluence table, but advanced features usually require an app.
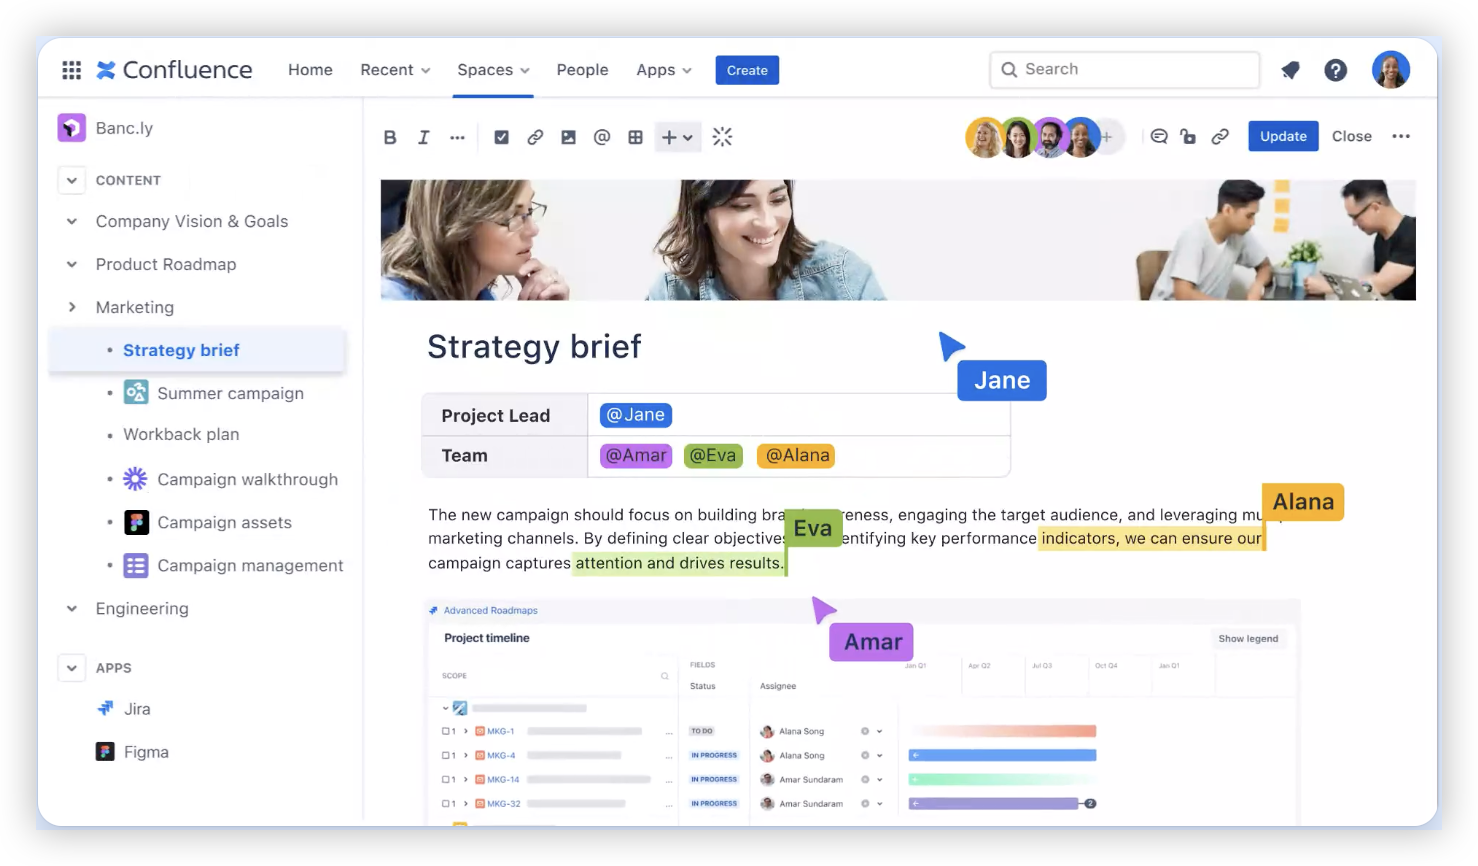
1. Define the project scope and major milestones
Start with the outcome your team must deliver. Then identify the milestones that show meaningful progress toward that outcome.
For example, a website redesign might include these milestones:
- Requirements approved
- Wireframes completed
- Visual design approved
- Development finished
- Quality assurance completed
- Website launched
Keep milestones outcome-focused. “Design work” is vague, while “Homepage design approved” gives the team a clear finish line.
2. Break milestones into manageable tasks
Each milestone should contain smaller tasks with an owner, start date, and finish date. A task should be specific enough for one person or a small team to manage.
For the homepage design milestone, you might create tasks such as:
- Review brand requirements
- Create two layout concepts
- Collect stakeholder feedback
- Apply revisions
- Approve the final layout
Avoid making every action a separate task. If a task takes only a few minutes, combine it with a related activity. Overloaded charts are difficult to maintain.
3. Choose the right way to build the timeline
You have three practical options, depending on the complexity of your plan and the Confluence setup your team uses.
| Method | Best for |
|---|---|
| Confluence table | Small plans with a simple date view |
| Gantt chart app | Projects requiring dependencies, progress tracking, and date adjustments |
| External chart integration | Teams already managing timelines in another approved platform |
A table can show task names, owners, dates, and status. It usually will not provide automatic dependency updates or a true time-scale bar.
For a product launch with dozens of related tasks, a dedicated Gantt app is usually more efficient. For a two-week content plan, a simple table may be enough.
4. Create or select the Confluence project page
Create a dedicated project planning page, or select an existing page that your team already visits regularly. Give it a clear name, such as “Website Redesign Timeline.”
Add a short summary above the chart. Include the project goal, project manager, planned launch date, and the date of the latest update.
This context matters because a timeline without a goal can become a collection of dates. Anyone opening the page should understand what the schedule represents within a few seconds.
5. Add the Gantt chart or timeline element
Open the Confluence editor and select the method you chose in Step 3.
Using a Confluence Gantt app
- Open the page editor.
- Select the option to insert a macro or app element.
- Search for the approved Gantt chart app.
- Insert the chart into the page.
- Choose whether to create a new plan or display an existing plan.
Using a simple Confluence table
- Insert a table with columns for task, owner, start date, finish date, status, and notes.
- Add one row for each project task.
- Use status labels to show progress.
- Group related tasks beneath milestone headings.
- Use a consistent date format throughout the page.
The exact menu names may differ between Confluence Cloud, Data Center, and installed marketplace apps. If you cannot find a Gantt option, check your administrator’s approved integrations.
6. Add dates, owners, milestones, and dependencies
Now turn the empty chart into a working project plan. Add the start and finish dates for every task, then assign each task to an accountable person or team.
Next, connect tasks that depend on one another. For example, “Apply design revisions” should begin after “Collect stakeholder feedback” is complete.
Useful dependency examples include:
- Content approval before page development
- Design approval before engineering begins
- Development completion before quality assurance
- Quality assurance approval before launch
Set milestones for events that do not require duration, such as approval meetings or launch dates. This makes important deadlines easy to spot.
7. Review, publish, and maintain the chart
Before publishing the page, check that every task has an owner and realistic dates. Look for missing dependencies, overlapping work, and deadlines that fall on weekends or holidays.
Then publish the page and tell the team how to use it. Explain where people should report progress, how date changes are approved, and when the timeline will be reviewed.
Schedule a weekly review for most projects. During that review, update completed work, move delayed tasks, and discuss the effect on later milestones.
The best part? A Gantt chart becomes valuable when it reflects the current plan. An attractive chart with outdated dates creates false confidence.
What a Useful Confluence Timeline Should Show
A useful timeline answers five questions immediately: What must happen, who owns it, when will it happen, what depends on it, and whether it is on track?
At minimum, include task names, responsible people, planned dates, status, and milestones. For larger projects, add priority, risk, completion percentage, and dependency information.
| Timeline element | Why it matters |
|---|---|
| Task name | Shows the work that must be completed |
| Owner | Clarifies accountability |
| Start and finish dates | Shows the planned work period |
| Milestone | Highlights a major outcome or decision |
| Dependency | Shows which work must happen first |
| Status | Communicates current progress |
For example, a task marked “In progress” may look healthy until you notice that its finish date is tomorrow and a required approval has not happened. Dependencies add the missing context.
How to Pick the Best Confluence Gantt Method
Choose the simplest method that can support your project’s coordination needs. Complexity should follow the work, rather than the other way around.
Use a table for a small, stable plan
A table works well for a short project with fewer than 15 tasks and limited dependencies. It is quick to create and easy for most contributors to understand.
For example, an internal training session may need tasks for agenda planning, speaker confirmation, promotion, registration, and event delivery. A table can handle that schedule comfortably.
Use an app for changing schedules
A dedicated Gantt app becomes more useful when one date change affects several later activities. Many apps can show relationships between tasks and shift related dates more efficiently.
Consider an app when your project includes multiple teams, several milestones, parallel workstreams, or a launch date that cannot move.
Use an integration when another platform owns the plan
If your team already manages work in a project platform, embedding or integrating the timeline may prevent duplicate updates. The Confluence page can then provide context while the project platform manages execution.
Check permissions carefully. A chart that appears on a page may still hide details from people who lack access to the connected platform.
How to Keep the Schedule Accurate
Most timeline problems come from maintenance, rather than initial setup. A plan can become inaccurate after one missed update or an unrecorded decision.
Assign one person to coordinate schedule changes. That person does not need to update every task, but should ensure that important changes are reflected consistently.
Use a regular review rhythm
Review active projects weekly. For short projects, a twice-weekly review may be more appropriate.
During each review, ask:
- Which tasks finished since the last review?
- Which tasks are late or at risk?
- Have any dependencies changed?
- Does the launch date remain realistic?
- Does anyone need a decision or additional support?
Separate planned dates from actual progress
Keep the original plan visible when your chosen app supports it. Comparing planned and actual dates helps you identify recurring delays.
For instance, if approval tasks regularly take three days longer than expected, future plans should reflect that pattern. This makes the schedule more realistic over time.
Common Mistakes When Building a Gantt Chart in Confluence
A Gantt chart can look organized while still failing to help the team. These mistakes are especially common when a chart is created only for presentation.
Adding too much detail
When every small action appears on the chart, the main milestones disappear. Keep detailed working notes in the relevant task area and show only coordination-level work on the timeline.
Leaving out dependencies
Dates alone do not explain project logic. If development cannot begin until design approval, connect those activities or clearly state the relationship.
Assigning tasks to a whole department
“Marketing team” does not identify accountability. Assign the task to a specific person, then involve the wider team when collaboration is required.
Using status labels without clear definitions
Agree on what “At risk,” “Blocked,” and “Complete” mean. Otherwise, two people may use the same label for very different situations.
Building Project Timelines with ONES.com
ONES.com gives teams a unified environment for project management and knowledge management. ONES Project is the project management product and can support Gantt-style planning, while ONES Wiki provides a structured knowledge base. They are sold separately.

For teams that want a Jira alternative with planning, execution, and project knowledge in a connected environment, ONES.com can reduce the need to maintain multiple plugins and disconnected workspaces.
Core capabilities
- Scattered project information → Unified project and knowledge management: Keep project planning and team knowledge connected, so people spend less time searching across separate systems.
- Unclear schedule ownership → Task assignment and sprint management: Give work to specific people, organize iterations, and make responsibility visible.
- Frequent date changes → Custom workflows and dependencies: Represent approval steps and related activities, helping the team understand how one delay affects later work.
- Limited visibility → Built-in reporting: Turn project activity into progress views that help managers spot risks without manually assembling updates.
- Rigid processes → Custom fields and workflows: Adapt the project structure for launch stages, risk levels, approval states, or other team-specific requirements.
- Repetitive coordination → Automation: Reduce routine actions, such as moving work after an approval or notifying a responsible person about a status change.
- Jira migration concerns → Jira-compatible workflows: Preserve familiar project practices while evaluating a Jira alternative for teams that want a broader workspace.
- Deployment restrictions → Four deployment options: Choose Cloud, On-Premise, Private Cloud, or Air-gapped deployment while retaining feature parity between cloud and self-hosted versions.
Application scenarios
Product launch planning: A product team can connect requirements, design, development, testing, and release milestones. Managers can review progress through reports while contributors work through assigned tasks.
Restricted-network projects: An organization with strict network controls can use an On-Premise, Private Cloud, or Air-gapped deployment. The team can still manage workflows without moving project activity into an unsuitable environment.
Cross-functional approval work: Marketing, engineering, legal, and operations can follow a shared workflow. Custom fields can identify approval owners, risks, and planned release stages.
Common Challenges and Practical Solutions
The chart does not appear in Confluence
Problem: The required macro or integration is unavailable in the editor.
Solution: Confirm whether your Confluence edition supports the chosen app. Ask an administrator to review installation, permissions, and workspace restrictions. If necessary, create a structured table as a temporary alternative.
Dates are difficult to read
Problem: The chart contains too many tasks or uses inconsistent date formats.
Solution: Group work by milestone, remove minor actions, and use one date format. Show the high-level plan first, then link to detailed task areas where appropriate.
Team members forget to update progress
Problem: The timeline becomes outdated after the first planning meeting.
Solution: Make updates part of an existing weekly meeting. Assign ownership for each task and define what counts as complete, blocked, or at risk.
Dependencies create unrealistic deadlines
Problem: Several tasks appear to run in parallel even though one cannot start until another finishes.
Solution: Map the dependency chain before setting final dates. Add buffer time around approvals, testing, procurement, and other activities that often take longer than expected.
FAQs
Can Confluence create a Gantt chart without an app?
Confluence can show a simple project schedule with a table, task list, dates, and status labels. However, a full Gantt view with timeline bars, dependencies, and automatic date changes usually requires a marketplace app or an integration. Your available options depend on the Confluence edition, administrator settings, and installed extensions.
What should I include in a Confluence project timeline?
Include the task name, owner, start date, finish date, status, milestone relationship, and important dependencies. Add risk or priority fields for larger projects. Keep the chart focused on work that affects coordination. Tiny actions can make the timeline difficult to scan and maintain.
How many tasks should a Gantt chart contain?
There is no fixed limit, but a single view should remain easy to understand. A small project may need fewer than 15 tasks, while a large project can use separate views for each workstream. Show milestones and major activities at the top level, then manage detailed work in the appropriate project area.
How often should I update the schedule?
Update an active project at least once a week. If the project lasts only a few weeks or includes daily dependencies, review it more frequently. Update the timeline whenever a major decision changes scope, ownership, sequencing, or the planned launch date.
What is the difference between a timeline and a Gantt chart?
A timeline usually presents major events in chronological order. A Gantt chart provides a more detailed schedule with task durations, owners, progress, milestones, and relationships between activities. A timeline is useful for executive communication, while a Gantt chart is usually better for coordinating project execution.
Conclusion
Creating a Gantt chart in Confluence requires seven practical actions: define milestones, break them into tasks, choose a chart method, prepare the page, add the timeline, connect dependencies, and maintain the schedule.
But here’s the truth: the chart is only as useful as the planning habits around it. Keep ownership clear, review dates regularly, and remove unnecessary detail.
If Confluence’s native options feel limited, a dedicated project platform such as ONES.com may provide stronger scheduling, reporting, workflow, and deployment support. Start with the simplest approach that gives your team a reliable view of the work ahead.