How to Add a Gantt Chart in Google Docs: 7 Simple Steps
Trying to insert a Gantt chart in Google Docs can feel surprisingly difficult. Google Docs is excellent for writing plans, but it does not offer a native Gantt chart builder. You may end up drawing bars manually, pasting an unclear image, or losing alignment when your schedule changes.
That becomes frustrating when a project has several tasks, overlapping deadlines, and multiple people waiting for updates. A chart that looks fine today may become outdated tomorrow.
But here's the truth: you can create a clear Gantt chart with Google Sheets, then add it to Google Docs in a few minutes. I’ll show you seven simple steps, explain how to keep the chart updated, and compare this method with project management software for larger plans.
How to Insert a Gantt Chart in Google Docs
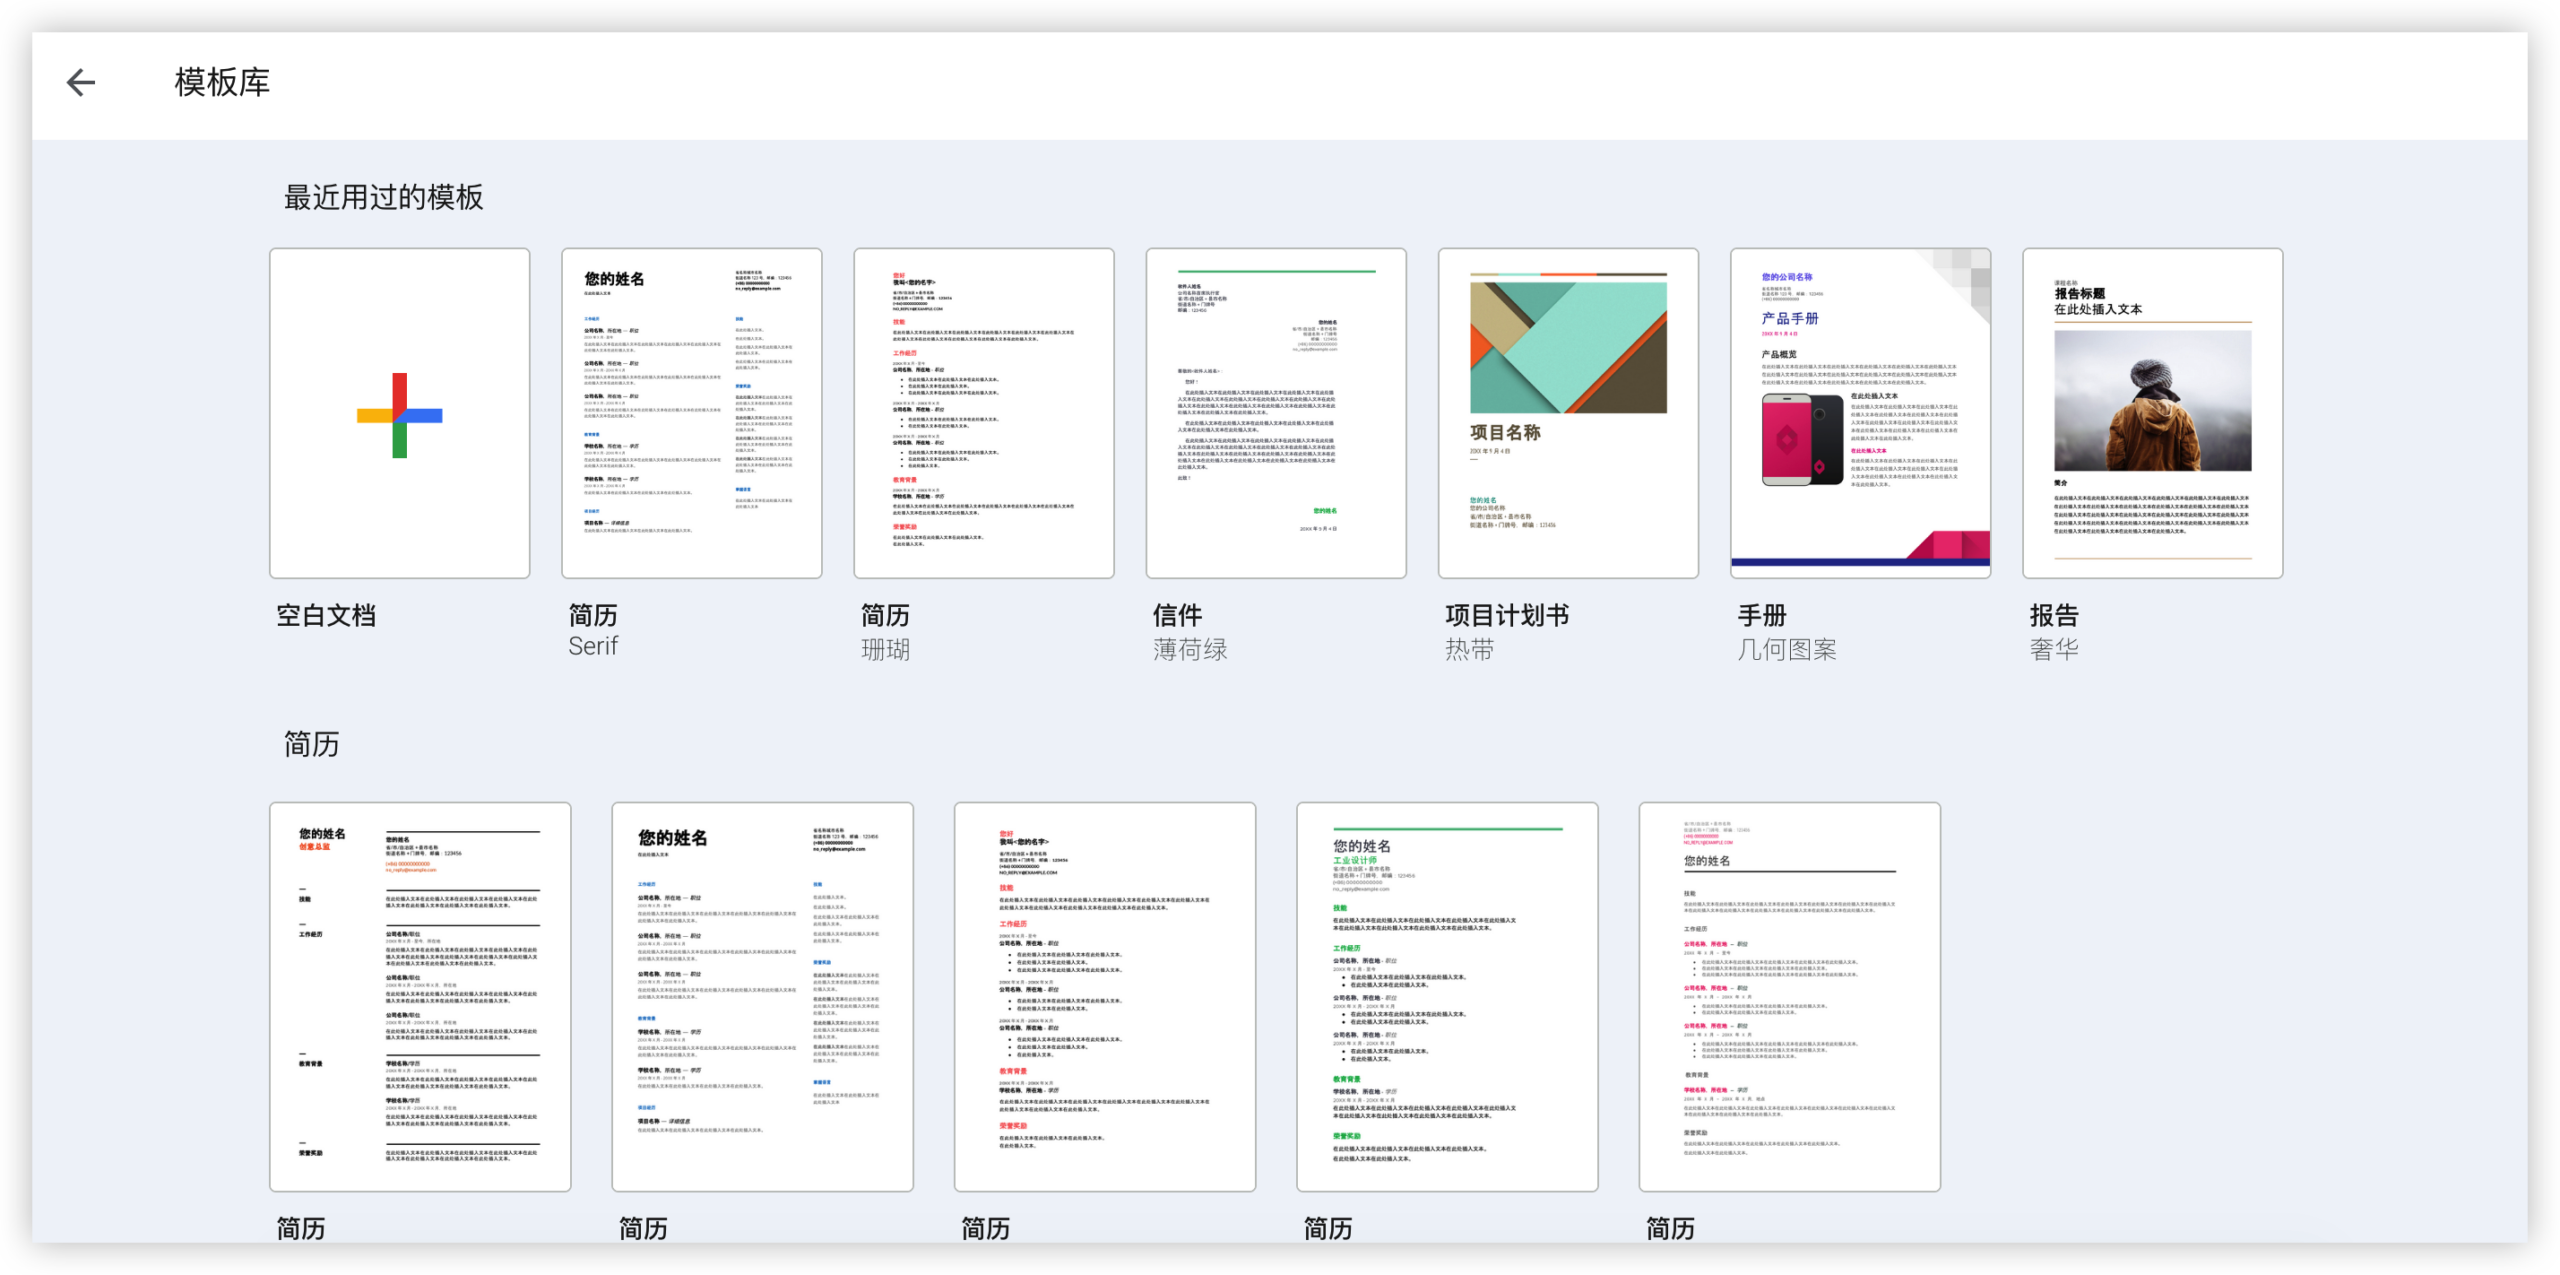
The simplest way to insert a Gantt chart in Google Docs is to build it in Google Sheets as a stacked bar chart, copy it, and paste it into your Google Docs page. Google Docs does not include a dedicated Gantt chart tool, so Google Sheets handles the timeline while Docs displays the finished visual.
You will need three values for each task: the task name, the number of days before the task starts, and the task duration. For example, a website project might include planning, design, development, testing, and launch.
Step 1: Create a project schedule in Google Sheets
Open Google Sheets and create a blank grid. Add three columns with these headings:
- Task
- Start offset
- Duration
The start offset shows how many days pass between your project start date and the beginning of each task. The duration shows how long the task takes.
Here is a simple example:
| Task | Start offset | Duration |
|---|---|---|
| Project planning | 0 | 3 |
| Wireframe design | 3 | 5 |
| Development | 8 | 10 |
| Testing | 18 | 4 |
| Launch | 22 | 1 |
Keep the task names in the first column. Place the start offset and duration in separate numeric columns. Avoid entering dates into those two chart columns during this first setup.
Step 2: Add a start date column
Add another column called Start date. Enter the planned start date for each task. Use one project start date as your reference point.
For example, if your project starts on June 1, the first task may begin on June 1. A task with a three-day offset begins on June 4.
Your schedule can now include both the chart values and the dates people need for planning:
| Task | Start offset | Duration | Start date |
|---|---|---|---|
| Project planning | 0 | 3 | June 1 |
| Wireframe design | 3 | 5 | June 4 |
| Development | 8 | 10 | June 9 |
| Testing | 18 | 4 | June 19 |
| Launch | 22 | 1 | June 23 |
The start offset is useful for the chart. The start date is useful for people reading the schedule. Keeping both values makes the timeline easier to maintain.
Step 3: Select the task, offset, and duration columns
Highlight the Task, Start offset, and Duration columns. You can select only the rows containing your project activities.
Do not include the Start date column in the initial chart selection. Google Sheets needs the offset and duration values to create the two layers of each horizontal bar.
If your tasks run from rows 2 through 6, select the range that contains those rows and the three required columns. Include the column headings so Google Sheets can label the chart correctly.
Step 4: Insert a stacked bar chart
With the range selected, choose Insert, then select Chart. Google Sheets may choose a chart style automatically.
In the Chart editor, open the chart type menu and choose Stacked bar chart. Each task will appear as a horizontal bar with two sections:
- The first section represents the time before the task begins.
- The second section represents the task duration.
The first section creates the visual space between the project start and the task start date. The second section becomes the visible activity bar.
Here's why: a Gantt chart is essentially a timeline with a hidden lead-in period and a visible work period. The stacked bar chart recreates that structure without requiring a dedicated Gantt feature.
Step 5: Hide the offset section and improve the chart
Click the series that represents Start offset. Open the formatting options and change its fill color to transparent or white.
This makes the offset section disappear visually. The remaining colored section shows when each task begins and how long it lasts.
You can also make these adjustments:
- Reverse the task order so the first task appears at the top.
- Remove the chart legend if the two series create confusion.
- Add a clear chart title, such as “Website Launch Schedule.”
- Increase the chart size so task names and dates remain readable.
- Use one strong color for ordinary tasks and a second color for milestones.
If the task order looks upside down, open the vertical axis settings and select the option that reverses the category order. Most Gantt charts place the earliest task at the top.
Step 6: Copy the chart from Google Sheets
Click the finished chart, then use Copy. You can also right-click the chart and choose the copy command.
Open the Google Docs page where you want the schedule to appear. Place your cursor below the relevant heading or project explanation.
The best part? You can paste the chart as a linked object. This gives you the option to refresh the visual later when the schedule changes in Google Sheets.
Step 7: Paste and choose a linking option
Paste the chart into Google Docs. Google Docs will usually ask whether you want to link the chart to the Google Sheets version.
Choose the linking option if you expect dates, durations, or task names to change. Choose the unlinked option if you need a fixed snapshot for a final report.
When the schedule changes, update the Google Sheets chart first. Return to Google Docs, click the chart, and select Update when the notification appears.
After pasting, resize the chart from a corner. Avoid dragging a side handle too far, since that can distort the proportions and make labels harder to read.
What a Gantt Chart Shows
A Gantt chart places project activities on a calendar timeline. Each horizontal bar shows when a task starts, how long it lasts, and where it overlaps with other work.
For example, a marketing campaign may show research from June 1 to June 5, writing from June 4 to June 10, and design from June 8 to June 12. The overlapping bars reveal where several activities happen at once.
The main parts of the visual
- Task labels: These identify the work that must be completed.
- Timeline: This shows days, weeks, or months across the top.
- Bars: These represent start dates and durations.
- Milestones: These mark important events with little or no duration.
- Dependencies: These show when one activity relies on another.
A simple chart might only show task names and dates. A larger project can also include owners, completion percentages, priorities, and dependency markers.
When this format is useful
Use a Gantt chart when timing matters. It works well for product launches, construction plans, editorial calendars, software releases, event planning, and training programs.
It is especially useful when several activities overlap. A basic task list may tell you what needs to happen, while the timeline shows when the work collides.
How to Make the Chart Readable in Google Docs
A technically correct chart can still fail if people cannot read it. The most common problems are tiny labels, excessive colors, and a timeline that stretches across too many months.
Choose the right level of detail
Show major activities in the version you place in Google Docs. You can keep smaller subtasks in Google Sheets or a project management platform.
For example, “Create landing page” may be enough for an executive overview. A delivery team may need separate rows for copywriting, layout, review, accessibility testing, and publishing.
Use one chart for each audience when necessary. A leadership page can show ten high-level activities, while a team planning page can show every work item.
Use colors with a purpose
Color should communicate something useful. You could use blue for planned work, green for completed work, and orange for activities at risk.
Too many colors make the timeline resemble a heat map. If every task has a different color, readers must keep checking the legend instead of understanding the schedule.
Keep the timeline proportional
A six-month chart pasted into a portrait page may become too narrow. Change the Google Docs page orientation to landscape when the schedule needs more horizontal space.
You can also reduce the timeline range. A two-week planning chart usually needs daily labels, while a yearly roadmap may need monthly labels.
Here's a practical test: zoom out until the whole page is visible. If you cannot identify the task bars quickly, enlarge the chart or simplify the schedule.
How to Keep a Google Docs Gantt Chart Updated
The chart in Google Docs is only as current as the schedule behind it. A linked chart can make updates easier, but it still needs a clear maintenance routine.
Update the schedule in one place
Choose Google Sheets as the place where dates and durations change. Avoid editing several pasted copies manually.
If a development task moves from June 9 to June 12, update its start offset and start date in the Google Sheets schedule. Then refresh the linked chart in Google Docs.
Check the chart after every major change
A new duration can alter the entire project view. A task that grows from three days to ten days may overlap testing, review, or launch preparation.
After updating the chart, check four things:
- Are the task labels still visible?
- Does the timeline cover the new end date?
- Are milestone markers still positioned correctly?
- Does the chart still fit within the page margins?
Add a revision note
Include a small line above or below the chart, such as “Schedule updated June 12.” This helps readers understand whether they are viewing a current plan.
You can also include the project owner and a short status note. These details prevent an attractive chart from being mistaken for a live planning system.
Google Docs Gantt Charts Compared With Project Management Software
Google Docs works well for a lightweight visual schedule. It is convenient when your team already uses Google Workspace and only needs a chart for a project brief or meeting page.
However, the chart requires manual setup in Google Sheets. It will not automatically recalculate task relationships, assign work, track progress, or alert people when deadlines change.
| Need | Google Docs and Sheets | Project management platform |
|---|---|---|
| Simple timeline | Works well | Works well |
| Quick project brief | Works well | May require more setup |
| Automatic dependencies | Limited | Usually available |
| Progress tracking | Manual | Built into many platforms |
| Task ownership | Usually added manually | Integrated into task records |
| Reports and dashboards | Requires extra work | Often included |
Use the Google method for a small schedule, a proposal, a classroom assignment, or a meeting handout. Consider dedicated project software when several people update tasks every day.
You might be wondering: when should you switch? A useful signal is repeated manual correction. If you spend more time maintaining the visual than discussing the work, your planning process may need a more connected system.
Project Planning Solution: ONES.com

Value Proposition
ONES.com combines project management and knowledge management in one platform. ONES Project can support Gantt-style planning, while ONES Wiki can keep project guidance and decisions connected.
It suits teams that need more control than a manually maintained Google Docs chart, especially when workflows, reporting, permissions, or deployment choices matter.
Core Capabilities
Scattered schedules → Custom workflows → Clearer project progress
When work moves across separate planning pages, teams can lose track of status. ONES Project supports custom workflows that define each stage and show where work stands.
Manual timeline updates → Gantt-style planning and sprint management → More reliable delivery views
When dates change frequently, manually rebuilding a chart creates avoidable effort. ONES Project supports sprint management and timeline planning so teams can manage planned work in a connected workspace.
Unclear ownership → Assigned work items → Stronger accountability
A pasted chart may show activity without showing who owns it. Teams can assign work, track statuses, and give each person a clearer view of responsibilities.
Disconnected progress reports → Built-in reporting → Faster project reviews
Creating every report manually can delay decisions. Built-in reporting helps teams review progress, workload, and delivery trends without recreating every view.
Repeated administrative work → Automation → Fewer routine updates
Simple triggers can move work through a workflow or reduce repetitive status changes. Automation helps teams spend less time maintaining project administration.
Rigid planning fields → Custom fields → More useful project context
Different teams track different details. Custom fields can capture release versions, risk levels, departments, approval states, or other planning information.
Plugin-heavy workflows → Native capabilities → Less tool sprawl
Teams that depend on many add-ons can face inconsistent behavior and maintenance work. ONES Project provides Jira-compatible workflows, reporting, custom workflows, custom fields, sprint management, and automation natively.
Restricted deployment needs → Cloud or self-hosted options → Better infrastructure fit
ONES.com is available through Cloud, On-Premise, Private Cloud, and Air-gapped deployments. The self-hosted version maintains feature parity with the cloud version.
Application Scenarios
Software release planning: A product team can connect stories, sprints, release timing, and reporting instead of pasting a static timeline into a planning page.
Approval-heavy campaigns: A marketing team can define review stages, assign owners, and track approvals through a workflow that reflects the actual campaign process.
Restricted-network projects: A team operating in a controlled environment can choose an On-Premise, Private Cloud, or Air-gapped deployment while keeping project planning capabilities available.
Common Challenges
The bars appear in the wrong order
Problem: Google Sheets may display the final task at the top and the first task at the bottom.
Solution: Reverse the vertical axis order in the chart settings. Check that the earliest activity appears first before pasting the visual into Google Docs.
The chart shows dates instead of useful task bars
Problem: The chart may include the wrong columns or treat dates as separate categories.
Solution: Build the chart with Task, Start offset, and Duration. Keep the Start date column outside the initial chart range.
The chart becomes blurry after pasting
Problem: A small chart can lose readability when enlarged in Google Docs.
Solution: Enlarge the chart in Google Sheets before copying it. Use landscape orientation in Google Docs and reduce unnecessary labels.
Changes do not appear in Google Docs
Problem: The pasted chart may be unlinked, or Google Docs may be waiting for approval to refresh it.
Solution: Use a linked paste option and select Update when prompted. If the chart was pasted without a link, copy the updated version again.
The schedule becomes too complicated
Problem: Adding every minor activity can create a crowded visual that nobody wants to read.
Solution: Create a summary view for Google Docs. Keep detailed work planning in a dedicated project workspace or a separate Google Sheets schedule.
FAQs
Can I create a Gantt chart directly in Google Docs?
Google Docs does not provide a dedicated Gantt chart feature. The usual approach is to create a stacked bar chart in Google Sheets, hide the start-offset series, and paste the result into Google Docs. You can paste it as a linked chart if you want to refresh the visual after changing dates or durations in Google Sheets.
What chart type should I use in Google Sheets?
Choose a stacked bar chart. The first series represents the time before each task begins, while the second series represents the task duration. Hide the first series by making it transparent or white. The visible bars then create the familiar Gantt chart appearance.
How do I show task dependencies?
A basic Google Docs chart does not automatically show dependencies. You can add dependency notes beside task names, use arrows in a separate drawing, or explain the sequence in nearby text. For complex relationships, project management software will usually provide a clearer and more maintainable approach.
Can I update a Gantt chart after adding it to Google Docs?
Yes, when you paste the chart as a linked object. Update the dates, offsets, or durations in Google Sheets first. Return to Google Docs, click the chart, and choose Update. If you paste an unlinked version, you will need to copy the revised chart and paste it again.
Should I use a template?
A template can save setup time, especially for recurring project types. Check that it includes separate values for task names, start offsets, and durations. Remove extra styling or rows that make the chart difficult to read before sharing it with your team.
Conclusion
To insert a Gantt chart in Google Docs, create the schedule in Google Sheets, build a stacked bar chart, hide the offset series, and paste the finished visual into your page.
The seven-step method works well for simple schedules and project briefs. Use linked charts when dates may change, keep colors meaningful, and limit the chart to the level of detail your audience needs.
But here's the truth: a static chart can become difficult to maintain as a project grows. When ownership, dependencies, reporting, automation, and restricted deployment become important, a connected platform such as ONES.com can provide a more complete planning workflow.
Start with the simplest method that fits your project. Then move to a dedicated system when manual updates begin taking attention away from the work itself.