Gantt Charts Explained: A Clear Guide for Beginners [2026]
Projects can feel chaotic when nobody knows what should happen first, who owns each task, or whether the deadline is still realistic. A simple task list may show the work, yet it rarely shows timing, dependencies, or bottlenecks clearly.
That confusion becomes expensive when one delayed activity pushes several others behind it. A missed design review can postpone development, testing, launch preparation, and customer communication.
But here's the truth: you do not need advanced project management experience to understand the plan. A Gantt chart turns project activities into a visual timeline, helping you see dates, ownership, progress, and relationships in one place.
This guide explains what a Gantt chart is, how it works, when to use one, and how to build a practical version for your next project.
What Is a Gantt Chart?
A Gantt chart is a visual project schedule that shows tasks as horizontal bars across a timeline. Each bar represents an activity, its planned duration, and often its start date, finish date, owner, progress, and relationship to other tasks.
For example, a website redesign might include research, wireframes, visual design, development, testing, and launch. A Gantt chart places those activities on a calendar so you can see when each begins, how long it lasts, and which tasks must happen first.
The chart usually has a task list on the left and a time scale on the right. A bar stretching from March 3 to March 7 means the activity is planned for those dates.
The Main Parts of a Gantt Chart
Although layouts vary, most Gantt charts contain the same core elements. Understanding them helps you read a schedule quickly.
- Task list: The activities required to complete the project.
- Timeline: The calendar across the top, shown by days, weeks, months, or quarters.
- Task bars: Horizontal bars showing the planned duration of each activity.
- Milestones: Important checkpoints with little or no duration, such as an approval or launch.
- Dependencies: Links showing that one activity relies on another.
- Owners: The people or teams responsible for completing activities.
- Progress indicators: Visual markers showing how much work is complete.
- Baseline: The original approved schedule used for comparison during delivery.
How to Read One Quickly
Start with the timeline. Find today’s date, then scan across each bar. You can immediately see which activities are active and which deadlines are approaching.
Next, look for linked activities. If testing begins only after development ends, the relationship makes that handoff visible. If testing starts late, you can predict a possible launch delay.
Finally, compare progress with the calendar. A task that is 30% complete with only one day remaining deserves attention, even if its bar appears short.
How Gantt Charts Work in Practice
A Gantt chart connects project scope with time. You first identify the work, estimate its duration, arrange the sequence, and then monitor actual progress against the plan.
Here's why: project delays often happen between activities rather than inside them. A team may finish development on time, yet testing cannot begin because the testing environment is unavailable.
- List the required activities. Break the project into meaningful pieces, such as “approve homepage design” instead of a vague item like “finish website.”
- Estimate each duration. Use working days or weeks. Include review time, coordination, and likely revisions.
- Set start and finish dates. Place every activity on the calendar and check whether the schedule matches the target deadline.
- Connect dependent activities. Show which work must finish before another activity can begin.
- Add milestones. Mark events such as an approved plan, completed prototype, production release, or customer sign-off.
- Assign ownership. Give each activity a clear owner so responsibility does not disappear between teams.
- Track actual progress. Update completion levels, dates, and risks as work changes.
- Review the schedule regularly. Use weekly reviews for most projects and more frequent checks for short, high-risk work.
A Small Example
Imagine you are organizing a product launch. Market research runs from April 1 to April 5. Messaging begins on April 4, while design starts on April 7. A campaign review takes place on April 11, followed by launch preparation from April 14 to April 18.
The overlapping bars show that messaging can begin before research fully ends. The dependency between campaign review and launch preparation shows why an approval delay could affect the final date.
Dependencies and the Critical Path
A dependency explains the order between activities. The most common relationship is finish-to-start: one activity must finish before another starts.
For example, a team usually completes a technical design before development begins. Some activities can overlap, such as writing help content while developers complete an interface.
The critical path is the chain of dependent activities that determines the shortest possible project duration. If an activity on that path slips, the final deadline may slip too.
You might be wondering: does every project need a critical path analysis? Small projects may only need basic sequencing. Larger projects benefit from identifying the chain that deserves the closest monitoring.
Why Gantt Charts Are Useful
Gantt charts give you a shared view of timing. A project manager can use one to coordinate work, while a team member can check priorities without waiting for another meeting.
They Make Deadlines Visible
A task list tells you what needs doing. A timeline shows when it needs doing. That difference matters when several activities compete for the same people.
Suppose one designer owns three activities scheduled during the same week. A Gantt chart exposes the conflict before the work starts, giving you time to change priorities or add support.
They Reveal Bottlenecks
When many activities depend on one approval, specialist, or technical environment, the chart makes that constraint easier to spot.
For example, a security review may sit between development and release. If the reviewer has limited availability, you can reserve time early instead of discovering the problem near launch.
They Improve Team Coordination
People often perform better when they understand how their work fits the wider project. A developer can see when design approval is expected. A marketing team can see when product details should be ready.
The chart becomes a conversation tool. During a planning meeting, you can discuss a specific activity and date rather than debate the whole project from memory.
They Support Better Progress Reviews
A weekly review can compare planned progress with actual progress. If an activity started late, you can decide whether to adjust later dates, add capacity, reduce scope, or accept a new deadline.
The best part? You can make those decisions while there is still time to act.
When to Use a Gantt Chart
Gantt charts work especially well when activities have clear durations, deadlines, or relationships. They are useful for both one-time initiatives and recurring planning cycles.
Product Development
A product team may map discovery, requirements, design, development, testing, launch preparation, and post-launch review. The chart helps coordinate specialists who contribute at different stages.
Marketing Campaigns
A campaign schedule might include audience research, content creation, creative review, channel setup, approval, launch, and performance review. Overlapping bars show where parallel work is possible.
Construction and Operations
Construction teams can plan permits, site preparation, installation, inspections, and handover. Operations teams can schedule office moves, equipment changes, or process rollouts.
Software Releases
Release planning may include coding, code review, quality assurance, security checks, deployment preparation, and monitoring. Milestones can mark feature freeze, release approval, and production launch.
When Another View May Work Better
A Gantt chart may feel excessive for a two-hour personal task or a simple list of unrelated activities. A checklist can be faster when timing and dependencies matter very little.
Teams handling continuous incoming work may prefer a board that shows current status. A calendar can be better for appointments and fixed events. You can also combine views when each answers a different planning question.
How to Create a Useful Project Timeline
The quality of a Gantt chart depends on the quality of the planning behind it. A crowded chart with vague activities creates more confusion than clarity.
Start With Outcomes
Define what completion means before listing activities. “Launch the new customer portal” is an outcome. Its supporting activities might include interface design, data migration, access testing, training, and release communication.
Break Work Into Manageable Activities
A task should be specific enough for someone to understand the expected result. “Prepare testing environment” is easier to schedule than “handle testing.”
Avoid making every activity tiny. If a project contains hundreds of short bars, the schedule becomes difficult to maintain. Group related work when the individual details do not affect timing.
Use Realistic Estimates
Include review cycles, meetings, handoffs, holidays, and likely rework. A design activity that takes three focused days may require seven calendar days when approval time is included.
For uncertain work, use a range during planning. You might expect a task to take three to five days, then choose a schedule that protects the deadline.
Keep Dependencies Clear
Only link activities when the relationship matters. Excessive links create a rigid plan and make every change ripple through the schedule.
For example, copywriting may start with an early product brief and finish after final specifications. That work does not necessarily need to wait for every design detail.
Separate Planning From Tracking
Set an approved baseline before work begins. Then track actual dates and progress against it. This distinction helps you understand whether the plan changed or execution changed.
Review the Chart at the Right Rhythm
A monthly project may need a weekly review. A two-week release may need daily checks. Update the schedule often enough to support decisions, without turning every small change into administrative work.
Common Gantt Chart Mistakes
Many scheduling problems come from using the chart as decoration instead of as a working management tool. These mistakes are easy to avoid once you know what to watch for.
Adding Too Much Detail
A chart with every conversation, minor revision, and routine action becomes hard to read. Keep the main view focused on activities that affect delivery, ownership, or timing.
Ignoring Capacity
A schedule can look reasonable while assigning the same person to five overlapping activities. Check availability before approving dates.
Using Optimistic Durations
Short estimates can make a deadline look attractive. They also hide the effort needed for coordination and quality checks. Compare estimates with similar completed work whenever possible.
Failing to Update It
An outdated chart creates false confidence. If a review moved from Tuesday to Friday, update the related dates and communicate the effect.
Treating Every Date as Fixed
Some dates are firm, such as a regulatory deadline or booked event. Others are working estimates. Label that difference so the team knows where flexibility exists.
Gantt Chart Alternatives and Complementary Views
A Gantt chart answers the question, “When does each activity happen?” Other planning views answer different questions, so combining them can improve visibility.
| Planning view | Best question it answers |
|---|---|
| Gantt chart | When does each activity happen, and what depends on it? |
| Kanban board | What is waiting, active, blocked, or complete? |
| Calendar | What meetings, events, or fixed dates are coming up? |
| Task list | What work exists, and who owns it? |
| Roadmap | Which outcomes or themes are planned over a longer period? |
For example, a software team might use a roadmap for quarterly goals, a Gantt chart for a major release, and a board for daily execution.
Let me explain: these views do not compete when each has a clear purpose. The schedule shows timing, the board shows flow, and the roadmap shows direction.
Gantt Chart Solution: ONES.com

Value Proposition
ONES.com brings project management and knowledge management into one platform. ONES Project provides planning and execution capabilities for teams that need timelines, dependencies, reporting, and flexible workflows in one workspace.
It can suit teams looking for a Jira alternative with native project planning capabilities and fewer plugin dependencies.
Core Capabilities
Timeline planning for scattered schedules
Pain: Activities live across separate planning spaces, making timing difficult to understand.
ONES capability: ONES Project helps teams organize activities, dates, milestones, and dependencies in a unified project view.
Result: You can see the delivery path and discuss schedule changes with clearer context.
Custom workflows for inconsistent processes
Pain: Different teams move work through different approval and delivery stages.
ONES capability: Custom workflows let you reflect team-specific statuses and transitions.
Result: The planning structure can match your real process rather than forcing every team into the same sequence.
Custom fields for missing project context
Pain: Dates alone do not explain risk, priority, product area, or release information.
ONES capability: Custom fields add useful project attributes to activities and work items.
Result: Teams can filter and review plans using the information that matters to their decisions.
Built-in reporting for limited visibility
Pain: Managers spend time assembling progress updates manually.
ONES capability: Built-in reporting supports progress reviews and project status discussions.
Result: You can identify trends, delays, and workload concerns earlier.
Sprint management for iterative delivery
Pain: A long timeline does not always show what the team is delivering next.
ONES capability: Sprint management supports short planning and delivery cycles alongside broader project schedules.
Result: The team can connect near-term execution with larger milestones.
Automation for repetitive coordination
Pain: Repeated assignments, status changes, and notifications consume attention.
ONES capability: Automation can handle defined workflow actions when conditions are met.
Result: The team spends more time resolving risks and less time repeating routine updates.
Knowledge management through ONES Wiki
Pain: Plans become harder to follow when decisions and project knowledge sit elsewhere.
ONES capability: ONES Wiki provides a knowledge management space that can sit alongside project work.
Result: Teams can connect planning context with guidance, decisions, and operating knowledge.
Deployment flexibility for controlled environments
Pain: Some organizations require tighter control over where their project information is hosted.
ONES capability: ONES.com supports Cloud, On-Premise, Private Cloud, and Air-gapped deployments.
Result: Teams can select an environment that fits operational and security requirements.
Jira-compatible workflows with feature parity
Pain: Teams may want an alternative without abandoning familiar delivery practices.
ONES capability: ONES Project supports Jira-compatible workflows, reporting, custom workflows, custom fields, sprint management, and automation.
Result: A team can evaluate a Jira alternative while preserving important ways of working. Cloud and self-hosted versions provide full feature parity.
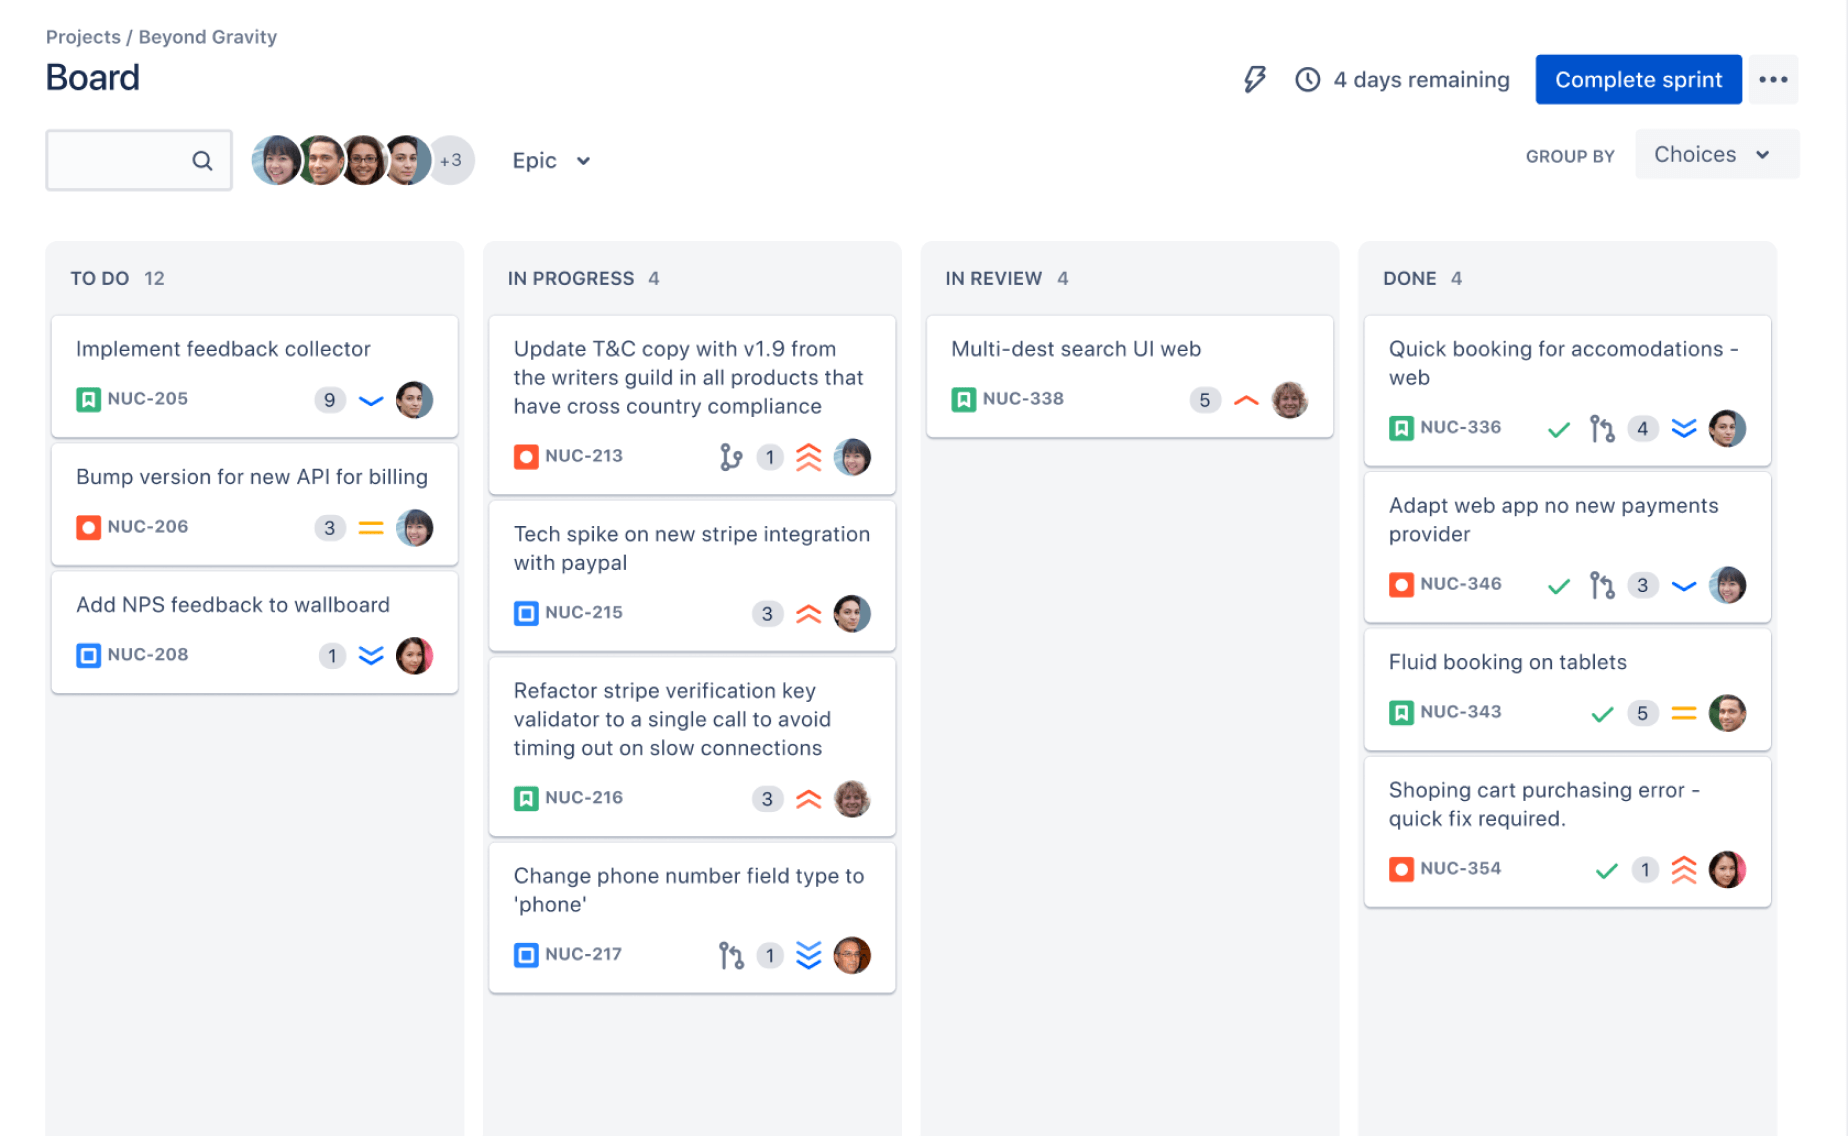
Application Scenarios
Software release planning: A product team can map development, testing, security review, release approval, and deployment. Sprint work can support the immediate delivery cycle while milestones preserve the larger release timeline.
Cross-functional launch: Marketing, design, engineering, and support can coordinate one launch schedule. ONES Wiki can hold shared guidance while ONES Project tracks ownership, dates, and progress.
Restricted-network delivery: An organization with strict network requirements can evaluate an On-Premise, Private Cloud, or Air-gapped deployment while keeping project planning within its controlled environment.
ONES.com offers a free plan for up to 30 seats. ONES Project and ONES Wiki are sold separately, so you can choose the product that matches your immediate planning or knowledge management needs.
Common Challenges and Practical Solutions
Challenge: The schedule keeps changing
Solution: Separate firm commitments from estimates, record the reason for major changes, and review the effect on dependent activities. A change becomes manageable when its impact is visible.
Challenge: Activities have unclear ownership
Solution: Assign one accountable owner to each major activity. Several contributors may help, yet one person should coordinate completion and raise risks.
Challenge: Estimates are frequently wrong
Solution: Compare planned duration with actual completion time. After several cycles, use those observations to improve future estimates and include a reasonable buffer.
Challenge: The chart is too crowded
Solution: Create a high-level schedule for leadership and a more detailed view for the delivery team. Use grouping and filters to show only the level of detail needed for the current conversation.
Challenge: People stop checking the schedule
Solution: Connect schedule reviews to existing planning meetings. Ask three practical questions: What changed, what is blocked, and what decision is needed?
FAQs About Gantt Charts
What is a Gantt chart used for?
A Gantt chart is used to plan, schedule, and monitor project activities across time. It helps you see task durations, deadlines, milestones, dependencies, ownership, and progress. For example, a product team can use one to coordinate design, development, testing, and launch. It is especially useful when several activities overlap or when one delay could affect later work.
What is the difference between a Gantt chart and a timeline?
A timeline usually presents important events in chronological order. A Gantt chart provides a more detailed schedule with activity durations, task relationships, ownership, and progress. A timeline might show three major launch phases, while a Gantt chart shows the individual activities supporting each phase.
Can you use a Gantt chart for Agile projects?
Yes. Agile teams can use a Gantt chart for release planning, dependencies, milestones, and cross-team coordination. A sprint board can manage daily work, while the Gantt view shows how sprints contribute to a larger outcome. This combination works well when teams need both iterative execution and broader schedule visibility.
How detailed should a Gantt chart be?
Include enough detail to support decisions about timing, ownership, and dependencies. A major activity might last several days or weeks, while a highly complex project may need smaller work packages. If every minor action appears in the main view, the schedule becomes difficult to read. Use separate detailed views when necessary.
What makes a Gantt chart effective?
An effective chart has clear activities, realistic durations, meaningful dependencies, visible milestones, assigned owners, and regular updates. It should help you answer practical questions quickly: What is happening now? What comes next? What is delayed? Which activity could affect the final deadline?
Conclusion
A Gantt chart is a visual way to connect project activities with time. It shows when work happens, how long it may take, who owns it, and which activities depend on one another.
Start with a clear outcome, break the work into manageable activities, add realistic dates, connect important dependencies, and review progress regularly. Keep the chart focused enough for people to use every week.
But here's the truth: a schedule alone cannot rescue unclear priorities or missing ownership. It becomes valuable when your team uses it to make decisions, spot risks, and coordinate action.
Whether you use a simple planning method or a platform such as ONES.com, the goal remains the same: turn a complicated project into a visible, manageable path toward completion.