Gantt Charts Explained: A Beginner’s Guide to the Basics
Project deadlines slip when nobody can see how tasks connect. A simple to-do list may show what needs doing, yet it rarely reveals which delay will affect the entire launch.
That confusion grows when several people share work, dependencies, milestones, and changing priorities. You may spend more time explaining progress than improving it. A missed design review can quietly push testing, approval, and release dates.
But here's the truth: a Gantt chart can make that timeline visible in one place. It shows tasks across a calendar, connects related work, and helps you spot schedule pressure early. This beginner’s guide explains what a Gantt chart is, how it works, when to use one, and how to build a practical version for your next project.
What Is a Gantt Chart?
A Gantt chart is a visual project schedule that displays tasks as horizontal bars across a timeline. Each bar shows when a task starts, how long it lasts, and when it should finish.
Most Gantt charts place project activities on the left and calendar periods across the top. The bar’s position represents timing, while its length represents duration. You can also add owners, milestones, dependencies, and progress.
For example, a website project might include research, design, development, testing, and launch. A Gantt chart places each activity on a calendar so you can see where work overlaps and where one activity must finish first.
The Main Parts of a Gantt Chart
Although layouts vary, most charts contain the same practical elements. Understanding these parts makes the schedule easier to read.
- Task list: The activities required to complete the project.
- Timeline: The days, weeks, or months covering the project period.
- Task bars: Horizontal bars showing each activity’s start date, end date, and duration.
- Milestones: Important events with little or no duration, such as an approval or launch.
- Dependencies: Links showing how one task affects another.
- Progress indicators: Visual markers showing how much work has been completed.
- Task owners: The people or teams responsible for each activity.
How to Read the Timeline
Start with the task name, then follow its bar from left to right. The bar’s left edge indicates the planned start, and its right edge indicates the planned finish.
Bars arranged on the same row of time represent overlapping work. A bar that begins after another ends may indicate a sequential relationship. Arrows between bars make those relationships easier to understand.
A diamond often represents a milestone. For example, “Prototype approved” might appear as a diamond between design and development.
Why This Visual Format Helps
A schedule becomes easier to discuss when everyone sees the same timeline. You can identify overloaded periods, idle gaps, and tasks that depend on late decisions.
Imagine that testing starts on June 10, while development ends on June 12. The chart immediately exposes a conflict. Your team can adjust the plan before testing begins.
The best part? You do not need advanced project management knowledge to understand the basic view. Dates, bars, and relationships communicate a large amount of project detail quickly.
How Gantt Charts Work in Practice
A Gantt chart turns a project plan into a time-based picture. You begin with activities, estimate their timing, connect relationships, and update progress as work continues.
1. Break the Project Into Tasks
Begin with the project outcome, then list the work needed to reach it. Use clear activities that someone can own and complete.
For a product launch, your list might include market research, packaging design, supplier confirmation, quality testing, campaign preparation, and release approval.
A task should be specific enough to estimate. “Prepare launch” is vague, while “Approve campaign landing page” gives the team a clearer action.
2. Estimate Duration
Give each activity a realistic duration. Consider effort, waiting time, reviews, and available capacity.
For example, writing a campaign may take three working days. Approval may take two additional days, even if the writing finishes sooner.
Use ranges during early planning when uncertainty is high. You can refine the schedule after the team learns more.
3. Add Start and Finish Dates
Place every task on the calendar. Avoid scheduling work before its required conditions exist.
If development needs approved designs, the development bar should begin after the design approval milestone. This creates a schedule that reflects how the work actually happens.
4. Connect Dependencies
Dependencies show relationships between activities. The most common relationship means one task must finish before another can start.
For instance, “Complete security review” may need to finish before “Release to customers” begins. A delay in the first activity can therefore affect the second.
Here's why: dependencies reveal risk that a simple task list hides. They help you focus attention on work that controls future dates.
5. Assign Owners
Give each activity a responsible person or team. Ownership removes uncertainty during status reviews.
If a milestone is late, you can quickly discuss the cause with the right person. Clear ownership also prevents several people from assuming someone else is handling the same task.
6. Track Progress Regularly
Update the schedule when work starts, finishes, or changes. Mark completed activities and adjust remaining dates.
A weekly review may be enough for a six-month initiative. A daily review may suit a short release with tight deadlines.
Gantt Chart Example for a Small Project
Consider a two-week product webpage project. The team includes a marketer, designer, writer, developer, and reviewer.
| Task | Owner | Timing | Dependency |
|---|---|---|---|
| Confirm page requirements | Marketer | Days 1–2 | None |
| Write page copy | Writer | Days 2–4 | Requirements confirmed |
| Create page design | Designer | Days 3–5 | Requirements confirmed |
| Approve copy and design | Reviewer | Day 6 | Copy and design complete |
| Build the page | Developer | Days 7–9 | Approval complete |
| Test the page | Developer and reviewer | Days 10–11 | Build complete |
| Publish | Marketer | Day 12 | Testing complete |
This plan shows overlapping work. Copy and design can happen at the same time, but both must finish before approval.
It also exposes the project’s main timing risk. If approval moves from Day 6 to Day 8, development cannot begin on Day 7 without changing the plan.
What the Example Tells You
The chart does more than list twelve days. It explains how the days connect.
You can see that requirements influence both copy and design. You can also see that the approval milestone controls development, testing, and publishing.
That relationship helps the team prioritize. Protecting the approval date may matter more than finishing a low-impact activity early.
When to Use a Gantt Chart
Gantt charts work best when timing, sequence, and coordination matter. They can support short assignments and large programs alike.
Project Launches
A launch usually includes marketing, preparation, review, testing, and release activities. Many tasks overlap, while a few approvals control the final date.
A Gantt chart lets you compare planned launch work with actual progress. You can also identify which activity needs attention before the launch date becomes unrealistic.
Construction and Operations
Construction teams often depend on permits, deliveries, inspections, and completed site work. A timeline makes these relationships easier to coordinate.
For example, equipment installation may depend on electrical work and delivery confirmation. A delay in either area can shift several downstream activities.
Software Development
Development teams can use Gantt charts for releases, migrations, platform changes, and major feature programs.
Agile teams often use boards for daily work and a Gantt view for broader release planning. The board shows immediate activity, while the timeline shows how the release fits together.
When Another View May Work Better
A Gantt chart may feel excessive for a simple task with one owner and no meaningful timing relationships. A short checklist may be clearer.
It can also become difficult to maintain when every minor action receives its own bar. Use summary tasks for major workstreams and reserve detail for activities that affect delivery.
You might be wondering: should every project use one? No. Choose a Gantt chart when visual timing helps you make better decisions.
Benefits and Limitations of Gantt Charts
Gantt charts provide a strong planning view, but they cannot solve every project problem. Their value depends on the quality of the plan and the discipline of updates.
Key Benefits
- Clear timing: You can see when activities begin and end.
- Visible dependencies: You can identify work that controls later activities.
- Better coordination: Teams can understand overlapping responsibilities.
- Earlier risk detection: Schedule conflicts become easier to spot.
- Progress tracking: Planned work can be compared with completed work.
- Useful communication: Leaders can understand the delivery plan quickly.
Common Limitations
A chart can create false confidence when estimates are too optimistic. A polished timeline may still rest on unclear requirements or unavailable people.
Large charts can also become crowded. If a plan contains hundreds of tiny activities, readers may struggle to identify the important work.
Frequent changes create another challenge. When dates change but dependencies remain untouched, the schedule may stop reflecting reality.
How to Keep the View Useful
Show enough detail for decisions, then hide lower-level work when presenting the plan. Review dates with the people doing the work.
Use colors consistently. For example, blue can represent planned work, green can represent completed work, and red can signal a schedule risk.
Limit milestones to meaningful events. Too many milestone markers reduce their visual importance.
Natural Gantt Chart Planning with ONES.com

Value Proposition
ONES.com combines project management and knowledge management in one platform, powered by ONES Assistant. ONES Project is a Jira alternative for teams that need structured planning, custom workflows, and timeline visibility.
You can use ONES Project for project schedules and ONES Wiki for connected team knowledge. These products are sold separately, so you can choose the capability that fits your operating model.
Core Capabilities
Replace scattered planning with timeline views
Pain: Task lists make it difficult to understand timing across a large initiative.
ONES capability: ONES Project supports project planning with timeline and Gantt-style views.
Result: You can see task duration, sequencing, milestones, and schedule pressure in one visual plan.
Connect work through Jira-compatible workflows
Pain: Teams may need familiar issue-based processes while moving beyond Jira.
ONES capability: ONES Project supports Jira-compatible workflows for structured planning and delivery.
Result: Your team can preserve recognizable working patterns while organizing schedules in a different platform.
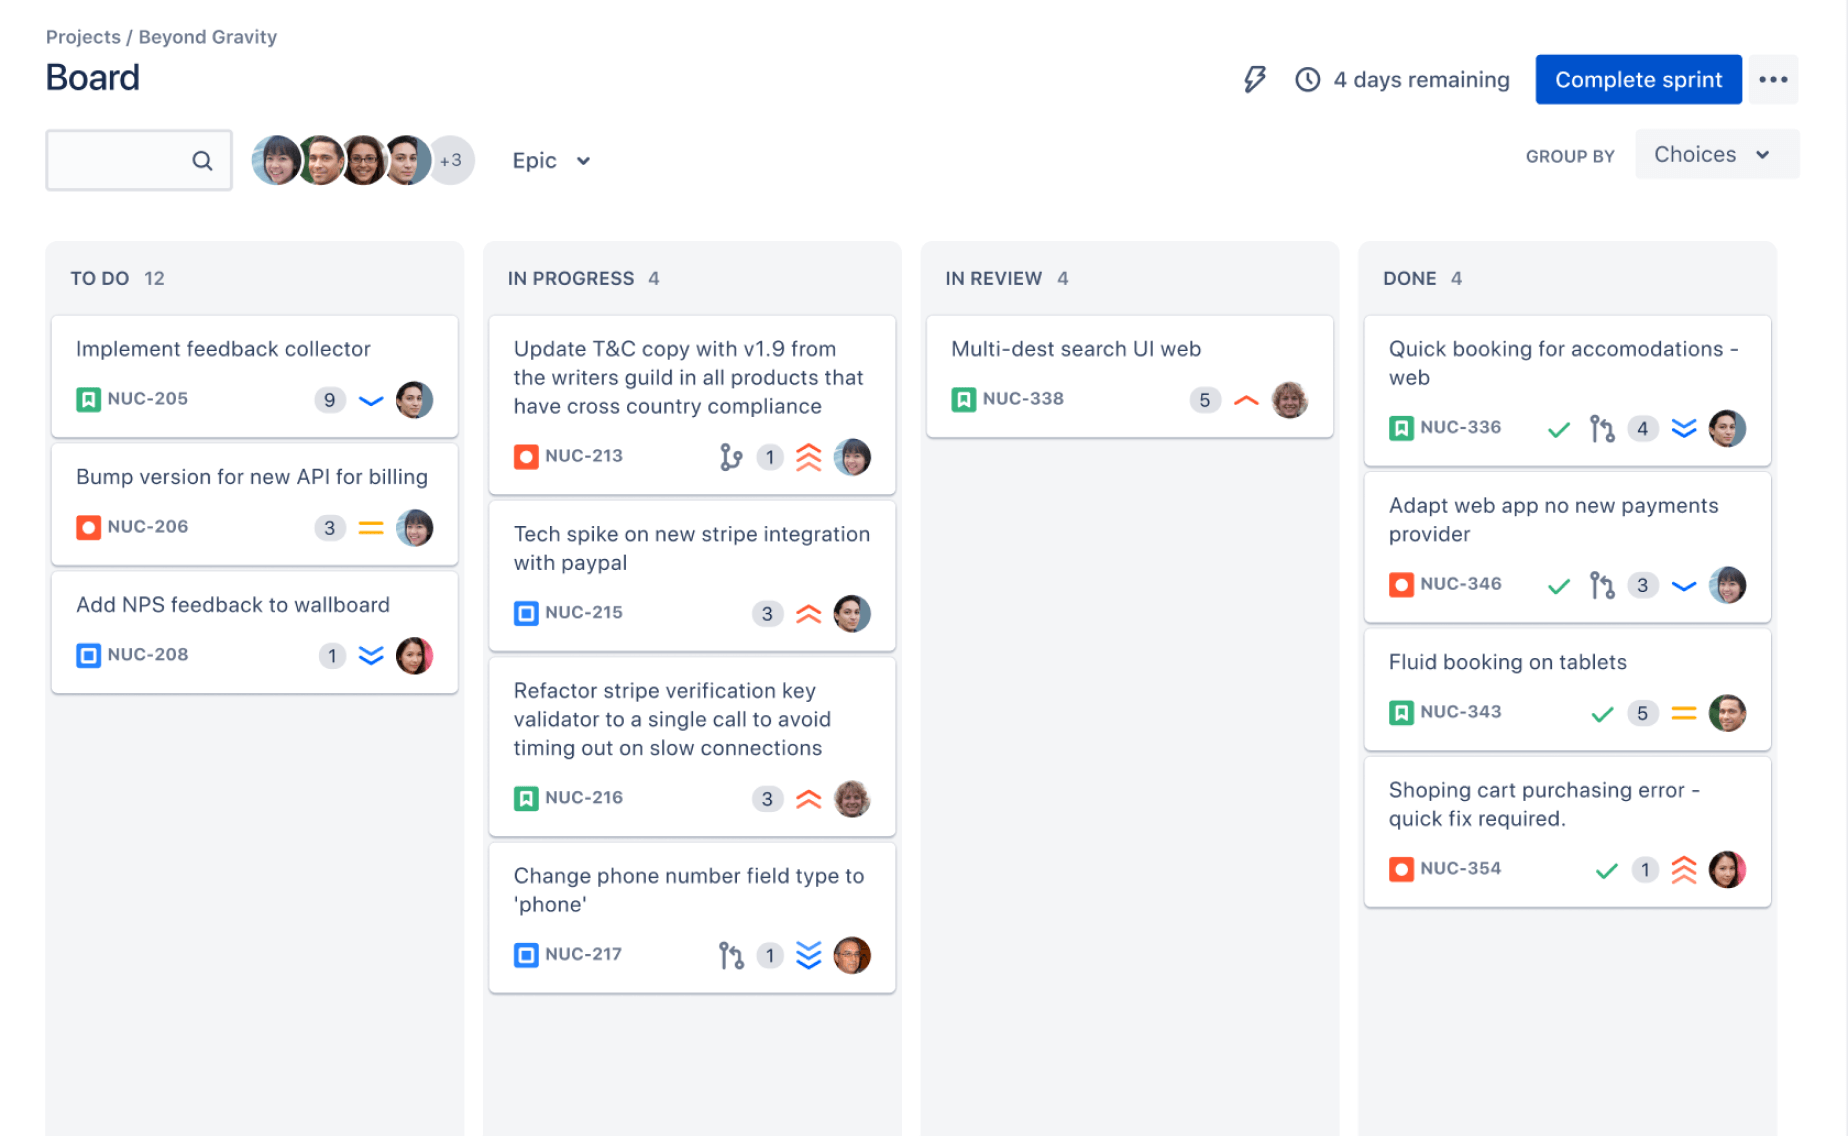
Reduce plugin dependence
Pain: Separate add-ons can create maintenance work and inconsistent project views.
ONES capability: Built-in reporting, custom workflows, custom fields, sprint management, and automation support common project needs.
Result: You can manage more planning and reporting requirements natively, with fewer plugins to coordinate.
Adapt the workflow to the project
Pain: A fixed workflow may not match the way your team handles approvals or reviews.
ONES capability: Custom workflows and fields let you reflect project-specific stages, ownership, and tracking needs.
Result: Your schedule can represent real operational steps instead of forcing every project into one pattern.
Support sprint and timeline planning together
Pain: Teams may struggle to connect short-term sprint work with longer delivery dates.
ONES capability: Sprint management works alongside broader project planning.
Result: You can relate immediate work to milestones and release objectives.
Automate repetitive coordination
Pain: Manual status changes and handoffs consume time during active delivery.
ONES capability: Automation can support recurring workflow actions and project updates.
Result: The team can spend more attention on exceptions, decisions, and delivery risks.
Keep project and team knowledge connected
Pain: Planning decisions may become difficult to find when they sit apart from project activity.
ONES capability: ONES Wiki provides knowledge management, similar to a Confluence alternative, while ONES Project handles project management.
Result: Teams can connect planning context with relevant guidance when both products are used together.
Choose a suitable deployment model
Pain: Some organizations cannot place project information in a public cloud environment.
ONES capability: ONES.com supports Cloud, On-Premise, Private Cloud, and Air-gapped deployments.
Result: Organizations can choose an environment that matches their security and infrastructure requirements.
Maintain feature parity across environments
Pain: Self-hosted software sometimes lacks capabilities available in hosted editions.
ONES capability: ONES.com provides full feature parity between cloud and self-hosted versions.
Result: Deployment choice does not require giving up core project planning functionality.
Application Scenarios
Software release planning: A product team can map requirements, development, testing, security review, and release approval. Sprint activities can support the broader timeline.
Restricted-network project work: An organization with strict network controls can use an air-gapped deployment while retaining project planning capabilities. This suits teams handling sensitive engineering or operational work.
Approval-heavy marketing programs: A marketing team can create custom stages for briefing, writing, design, legal review, final approval, and publication. Automation can help move work between stages.
Common Gantt Chart Challenges
Challenge: Estimates are too optimistic
Solution: Ask the person doing the work to estimate effort and waiting time. Add reasonable buffer around reviews, approvals, and external decisions.
Challenge: The chart contains too much detail
Solution: Group related activities under summary tasks. Show the most important work first, then expand details during team planning.
Challenge: Dependencies are missing
Solution: Ask what must happen before each major activity can begin. Connect only meaningful relationships, such as required approvals or completed technical work.
Challenge: The schedule becomes outdated
Solution: Set a regular review rhythm. During each review, update progress, confirm upcoming dates, and record decisions that affect the timeline.
Challenge: People interpret colors differently
Solution: Add a simple legend and use consistent visual rules. Keep color meanings stable across projects and status meetings.
Frequently Asked Questions
What is a Gantt chart used for?
A Gantt chart is used to plan, schedule, and monitor project work over time. It helps you see task duration, overlapping activities, dependencies, milestones, ownership, and progress. For example, a launch team can use one chart to connect preparation, review, testing, and release. The visual timeline also helps you spot a delay that may affect several later activities.
What does a bar represent on a Gantt chart?
A bar represents a scheduled task or activity. Its horizontal position shows when the work starts and finishes, while its length shows the planned duration. A short bar may represent a one-day review, while a longer bar may represent several weeks of development. Progress shading can show how much of that activity is complete.
What are dependencies in a Gantt chart?
Dependencies describe relationships between tasks. They show when one activity relies on another activity, approval, or condition. For example, testing may depend on development finishing. If development moves later, the testing date may also move. Showing this relationship helps you focus on schedule risks instead of treating every task as separate.
Are Gantt charts suitable for Agile teams?
Yes, Agile teams can use Gantt charts for release planning, cross-team coordination, migrations, and major programs. A sprint board can manage daily work, while a Gantt view shows how sprints connect to milestones and target dates. The chart works best when it remains a planning aid rather than a rigid prediction of every future activity.
How detailed should a Gantt chart be?
Include enough detail to support decisions, ownership, and coordination. A useful activity usually has a clear outcome, an owner, and a reasonable duration. Avoid adding every minor action to the main view. For a complex project, use summary tasks for presentation and keep deeper activities available when the team needs them.
Can I create a Gantt chart without specialized software?
Yes. You can create a basic chart with a calendar grid and colored bars. However, specialized project management software can simplify dependencies, progress updates, reporting, workflow changes, and collaboration. Choose the simplest approach that keeps the schedule accurate and easy for your team to maintain.
Conclusion
A Gantt chart is a visual timeline for project work. It shows tasks, durations, milestones, dependencies, owners, and progress so you can understand how the plan fits together.
Start with clear activities, estimate realistic durations, connect important relationships, and review the schedule regularly. Keep the main view focused on decisions rather than filling it with every minor action.
Remember the problem: disconnected task lists hide timing risks. The pressure comes when one late activity affects several others. The solution is a living timeline that makes those relationships visible.
For teams that need structured project planning, custom workflows, reporting, sprint management, automation, and flexible deployment, ONES.com provides a practical environment for turning timeline planning into coordinated delivery.