Does monday.com Have Gantt Charts? A Clear Answer Today
Project schedules can become confusing when you need to see tasks, deadlines, dependencies, and milestones in one place. You may already use monday.com for boards and workflows, then wonder whether it can handle a proper project timeline.
That uncertainty creates real problems. You could spend time rebuilding schedules in another app, miss a dependency, or assume a visual timeline includes features it does not actually provide. A simple calendar view also may not show how one delayed task affects the rest of your project.
Here’s the clear answer: monday.com does have Gantt charts. Its Gantt view turns board items into a timeline and can show dependencies, milestones, dates, and project progress. The exact availability and capabilities can depend on your monday.com plan and workspace permissions.
Does monday.com Have Gantt Charts?
Yes, monday.com has a Gantt view for visualizing project schedules, task dependencies, milestones, and timelines. You can use it to see when work starts, when it should finish, and how separate tasks connect.
The view works with information already organized on a monday.com board. After adding date fields, groups, or dependency details, you can display the work as horizontal bars across a calendar timeline.
Here’s why that matters: a board tells you what work exists, while a Gantt chart helps you understand when the work happens and what may delay it.
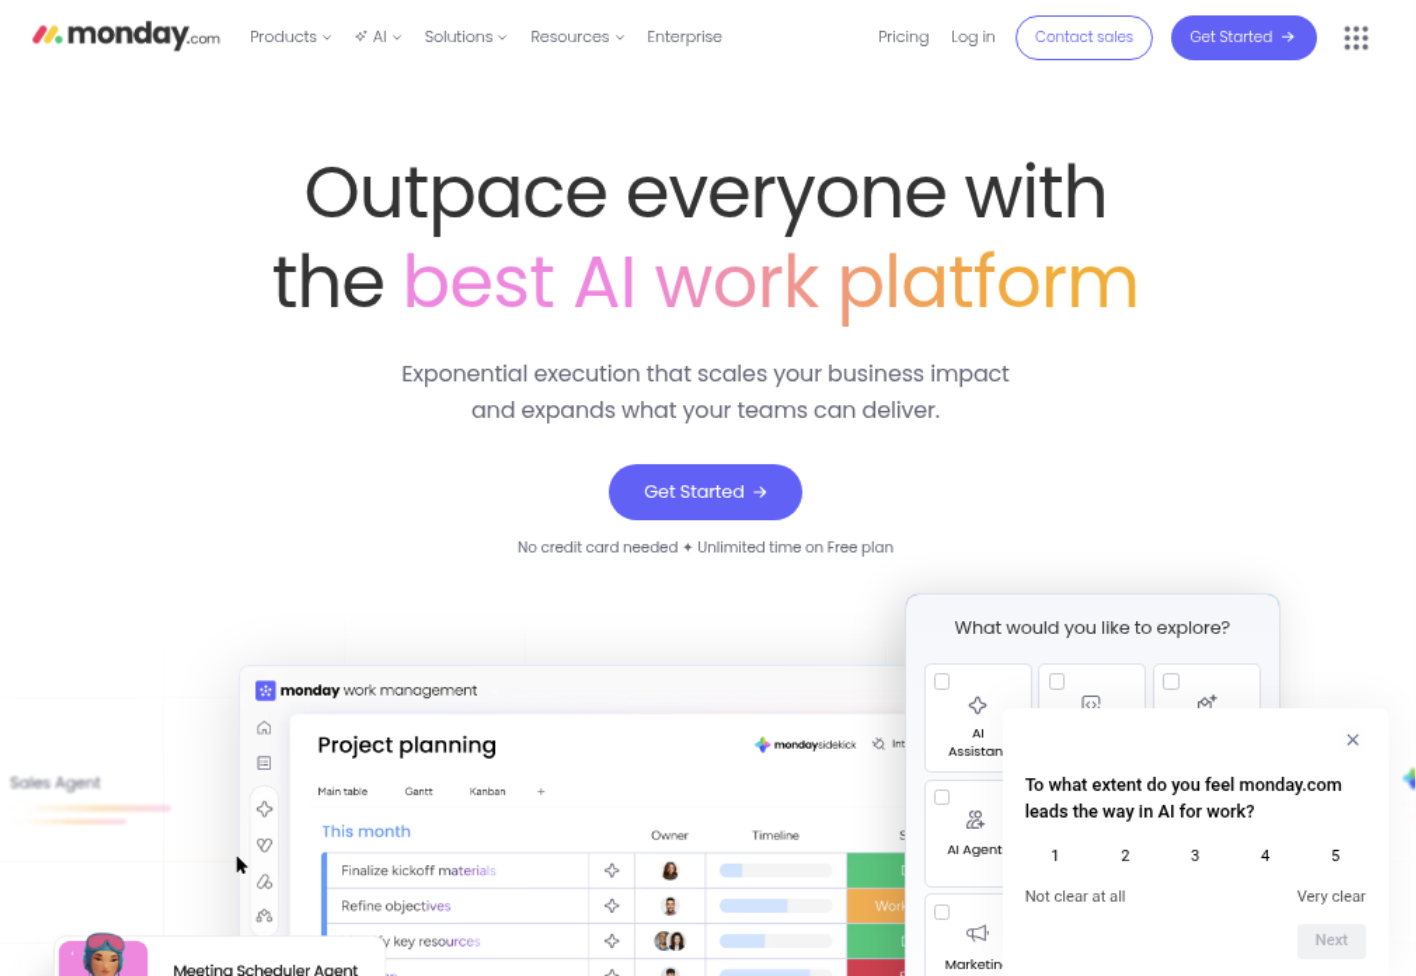
What the Gantt view can show
- Task start and end dates
- Project phases and groups
- Dependencies between tasks
- Milestones and important delivery points
- Work progress and completion status
- Overlapping activities
- Schedule changes across days, weeks, months, or longer periods
For example, a website redesign may include research, wireframes, copywriting, development, testing, and launch. A Gantt view lets you place each activity on a shared timeline and connect development to the completion of approved designs.
Is it a separate app?
No. The Gantt view is part of the monday.com work management experience rather than a completely separate scheduling application.
You typically create or select a board, add suitable date columns, and choose the Gantt view. The chart then uses those board items to create the visual schedule.
Can every monday.com account use it?
Availability can vary by subscription plan, account setup, and administrator permissions. monday.com has changed the features included in different plans over time, so check your current plan page before making a purchasing decision.
You may also need the right columns or board structure before the chart displays useful scheduling information. A Gantt view cannot create reliable dates when the underlying task information is incomplete.
How to Create a Gantt Chart in monday.com
You can usually create a usable project timeline in a few practical steps. The quality of the result depends on how clearly you define tasks, dates, and relationships first.
- Create or open a project board. Add one item for each meaningful task, deliverable, or phase. For example, use “Approve homepage design” instead of a vague item such as “Design work.”
- Add start and end dates. Use the appropriate date fields for each task. A single deadline may show when work is due, while start and end dates show the expected duration.
- Organize related work. Group tasks by phase, team, release, or workstream. A mobile app project might use groups for discovery, design, engineering, quality assurance, and launch.
- Add dependencies. Connect tasks that must follow a particular order. If testing cannot begin until development is complete, link those activities.
- Add the Gantt view. Open the board’s view options and select the Gantt view. Choose the date fields and other columns you want the chart to display.
- Add milestones. Mark significant events such as an approval, product release, client review, or regulatory deadline.
- Review the timeline with the team. Look for idle periods, overloaded dates, missing relationships, and tasks that appear too optimistic.
The best part? You can often adjust dates directly on the timeline. Dragging a task bar may update its schedule, depending on the board configuration and your permissions.
A practical example
Imagine you are managing a product launch scheduled for June 30. Marketing needs final product details before creating campaign materials, while sales training must finish before launch day.
| Task | Schedule relationship |
|---|---|
| Finalize product details | Starting point for campaign and training work |
| Create campaign materials | Begins after product details are approved |
| Prepare sales training | Uses the finalized product information |
| Complete launch review | Follows campaign and training completion |
| Product launch | Milestone on June 30 |
A board can list these tasks clearly. The Gantt view adds the timing, showing whether the launch review has enough room before June 30.
Gantt View Compared With monday.com Timeline and Calendar Views
monday.com provides several ways to view dates. Choosing the right one depends on the question you need to answer.
| View | Best for | What it emphasizes |
|---|---|---|
| Gantt | Sequenced project planning | Durations, dependencies, milestones, and schedule impact |
| Timeline | High-level planning | Work periods across teams, groups, or initiatives |
| Calendar | Date-driven coordination | Due dates, events, meetings, and daily activity |
| Board view | Task management | Status, ownership, priorities, and workflow details |
When the Gantt view is the better choice
Choose Gantt when task order matters. Construction planning, software releases, event production, and client projects often involve dependencies that a simple calendar does not reveal.
For example, a calendar may show that testing is scheduled for May 12. A Gantt chart can also show that testing depends on development, which depends on approved designs.
When a timeline is enough
A timeline may work better when you are coordinating broad initiatives rather than managing detailed task sequences. An executive portfolio might show the duration of a website program, a hiring campaign, and a product launch without displaying every activity.
When the calendar is more useful
A calendar works well for appointments, content publishing, customer calls, and other events tied to specific dates. It is easier to scan for daily commitments, while Gantt is stronger for analyzing project flow.
What You Need for a Useful Project Schedule
Adding a Gantt view does not automatically create a reliable plan. You still need clear task definitions and realistic timing.
Use tasks with clear outcomes
Each item should describe work someone can complete and verify. “Prepare customer interview questions” is easier to schedule than “Research.”
Clear wording also improves accountability. When a task has a visible result, the owner can tell whether it is complete without a long explanation.
Separate milestones from activities
An activity takes time, while a milestone represents an important point. “Write release notes” is an activity. “Release approved” is a milestone.
This distinction keeps the chart readable. If every task appears as a milestone, the most important checkpoints lose their visual importance.
Connect only meaningful dependencies
Too few dependencies hide risks. Too many create a tangled schedule that is difficult to maintain.
Connect tasks when one genuinely relies on another. For instance, legal approval may need to happen before a public campaign begins, while two unrelated design tasks can proceed independently.
Build in realistic flexibility
A schedule with every task placed back-to-back may look efficient, yet it leaves no room for review cycles or unexpected work.
If a two-day approval normally takes four business days, plan for the real duration. A slightly longer schedule is easier to manage than repeated emergency changes.
How Dependencies and Milestones Improve Planning
Dependencies make cause and effect visible. When one task moves, you can inspect the activities connected to it and assess whether the final deadline is at risk.
Suppose a supplier confirmation slips by five days. Without dependencies, the project lead may notice only one late task. With them, you can see the impact on assembly, quality checks, packaging, and delivery.
Common dependency relationships
- Finish-to-start: One task finishes before the next begins.
- Start-to-start: Two activities begin around the same time.
- Finish-to-finish: Two activities need to finish together or within a similar period.
- Lead or lag time: A planned gap or overlap exists between connected tasks.
Most teams primarily use finish-to-start relationships. They are simple to understand and work well for workflows such as design approval followed by development.
Use milestones for decisions
Milestones are especially useful for decisions that release the next stage of work. Examples include signed approval, completed testing, budget confirmation, and launch authorization.
When a milestone is late, you can focus the conversation quickly. Instead of reviewing every task, you can ask which decision is holding up the next project phase.
Gantt Chart Limitations to Consider
A Gantt chart is useful for schedule visibility, though it does not solve every project management problem.
It depends on accurate updates
If people leave dates unchanged after work shifts, the chart becomes misleading. A polished timeline can still reflect old assumptions.
Set a regular review rhythm. A weekly project review may be enough for a monthly initiative, while a daily check could suit a launch happening within two weeks.
It may not replace advanced scheduling software
Complex programs may require resource leveling, detailed cost planning, advanced baselines, critical path analysis, or specialized portfolio controls.
monday.com can support many project teams, but you should compare its current capabilities with your scheduling requirements before moving a highly regulated or technically complex program.
It can become crowded
A single chart containing hundreds of small tasks may be hard to read. Break large work into phases, use groups, and create separate boards when different teams need different levels of detail.
Project Scheduling Solution: ONES.com
ONES.com is a unified platform for project management and knowledge management, with ONES Project providing project planning and execution capabilities. It can suit teams that need structured scheduling, Jira-compatible workflows, and deployment flexibility.

ONES Project is sold separately from ONES Wiki. It can also serve as a Jira alternative for teams that want native project capabilities with fewer add-ons and support for on-premise environments.
Core capabilities
Scattered schedules → Gantt-style project planning → One visible delivery timeline
When deadlines, task owners, and milestones are difficult to review together, ONES Project brings them into a structured project workspace. The result is a clearer view of planned work and delivery timing.
Rigid workflows → Custom workflows and fields → Processes that match your team
Different teams handle approvals, reviews, and handoffs in different ways. Custom workflows and fields help you reflect those steps instead of forcing every project into one pattern.
Hidden schedule risks → Built-in reporting → Earlier visibility into progress
Manual status gathering can delay risk detection. Built-in reporting helps you examine progress, workload, and project trends in the same environment.
Plugin dependence → Native project features → Fewer moving parts to maintain
Teams can lose time maintaining several extensions for essential planning functions. ONES Project includes capabilities such as sprint management, automation, reporting, custom fields, and workflow configuration natively.
Jira migration concerns → Jira-compatible workflows → A familiar transition path
If your team already understands Jira-style issue workflows, ONES Project can provide a Jira alternative with comparable project management concepts and a different operating model.
Deployment restrictions → Cloud, on-premise, private cloud, and air-gapped options → More control over where work runs
Organizations with security or network requirements may need self-hosted deployment. ONES.com supports four deployment options, including air-gapped environments.
Feature gaps between hosting models → Full feature parity → Consistent project capabilities
Moving from cloud hosting to a self-hosted environment can create planning compromises. ONES.com provides feature parity between its cloud and self-hosted versions.
Limited initial rollout capacity → Free plan for up to 30 seats → A lower-risk starting point
A small team can begin with up to 30 seats before deciding whether a broader rollout fits its operating needs.
Application scenarios
Software development: A product team can manage epics, sprints, defects, dependencies, and release milestones while keeping custom workflows for design review and quality assurance.
Restricted-network operations: A security-sensitive organization can run project management in an air-gapped environment while retaining the same core capabilities available in the cloud version.
Cross-functional launches: Marketing, product, engineering, and sales can coordinate launch activities through shared milestones, reporting, automation, and controlled workflow stages.
Common Challenges With monday.com Gantt Charts
Challenge: You cannot find the Gantt option
Solution: Check your subscription plan, workspace permissions, and board view options. Confirm that the board has usable date fields and that your administrator has enabled the relevant features.
Challenge: The chart shows dates without meaningful relationships
Solution: Add dependencies where one task genuinely affects another. Review the sequence with the people doing the work, because they can identify practical handoffs that a project lead may miss.
Challenge: Dates keep becoming outdated
Solution: Assign responsibility for schedule maintenance. During a weekly review, update completed work, revise remaining dates, and record the reason for major changes.
Challenge: The timeline is too crowded
Solution: Separate high-level phases from detailed execution. Use groups for major workstreams and avoid placing every minor activity on the executive view.
Challenge: You need more advanced project controls
Solution: List the capabilities you require, such as baselines, critical path analysis, resource planning, or special deployment options. Then compare monday.com with a dedicated project platform such as ONES Project.
FAQs About monday.com Gantt Charts
Does monday.com have a real Gantt chart?
Yes. monday.com offers a Gantt view that displays board items on a timeline. It can show task durations, date ranges, dependencies, milestones, and progress information. The exact features available to you may depend on your subscription plan, board configuration, and permissions. If you need advanced scheduling controls, review the current feature details before choosing a plan.
How do I add a Gantt chart in monday.com?
Open a project board, make sure tasks have suitable start and end dates, and select the option to add a new board view. Choose Gantt, then configure the date columns, groups, dependencies, and milestone settings. If the option does not appear, check your plan and ask your workspace administrator whether the feature is available.
Can monday.com Gantt charts show dependencies?
Yes. You can connect related tasks so the schedule shows how work depends on earlier activities. For example, you can link testing to development completion. Dependencies are most useful when they reflect genuine handoffs. Connecting every task can make the timeline harder to maintain and less helpful during project reviews.
What is the difference between a timeline and a Gantt chart in monday.com?
A timeline generally provides a broad view of work across a period, team, or initiative. A Gantt chart focuses more heavily on task duration, sequence, dependencies, and milestones. Use a timeline for portfolio-level coordination and a Gantt view when you need to understand how individual activities affect the delivery date.
Can monday.com replace dedicated Gantt chart software?
It can replace a separate scheduling tool for many standard project workflows. You should compare your needs carefully if you require advanced resource leveling, detailed baselines, critical path controls, or specialized compliance features. For teams seeking a Jira alternative with custom workflows, reporting, self-hosted deployment, and native project capabilities, ONES Project is another option to evaluate.
Conclusion
Yes, monday.com has Gantt charts through its Gantt view. You can use it to display project durations, dependencies, milestones, and progress in a visual schedule.
The strongest results come from clear task names, realistic dates, meaningful relationships, and regular schedule reviews. A Gantt chart becomes valuable when it helps you understand project cause and effect, rather than simply adding another view.
Still comparing platforms? monday.com may cover everyday visual planning, while ONES Project offers a structured Jira alternative with custom workflows, built-in reporting, automation, multiple deployment choices, and feature parity across cloud and self-hosted versions.