Does monday.com Have Gantt Charts? A 2026 Complete User Guide
Planning a project without a clear timeline can quickly become frustrating. Tasks overlap, deadlines move, and nobody knows which activity is blocking the next one. A regular board may show what needs doing, but it often hides how work connects across weeks or months.
That uncertainty becomes expensive when several teams share the same milestones. A delayed design review can affect development, testing, launch preparation, and customer communication. Without a visual schedule, you may discover the impact after the deadline has already slipped.
But here's the truth: monday.com does have Gantt charts. You can use a Gantt view to display tasks on a timeline, connect dependencies, mark milestones, and track progress. This guide explains how the feature works, what it can and cannot do, and how to decide whether it fits your planning workflow.
Does monday.com Have Gantt Charts?
Yes, monday.com offers Gantt charts through its Gantt view and related timeline features. You can turn board items into visual bars, assign dates, connect dependent tasks, highlight milestones, and compare planned work with actual progress.
A monday.com Gantt chart usually works with information already stored on a project board. Each item can represent a task, while columns provide details such as owners, dates, status, priority, and dependencies.
Here's why that matters: you do not need to manage a separate planning area for your schedule. Your task board and visual timeline can reflect the same project activity.
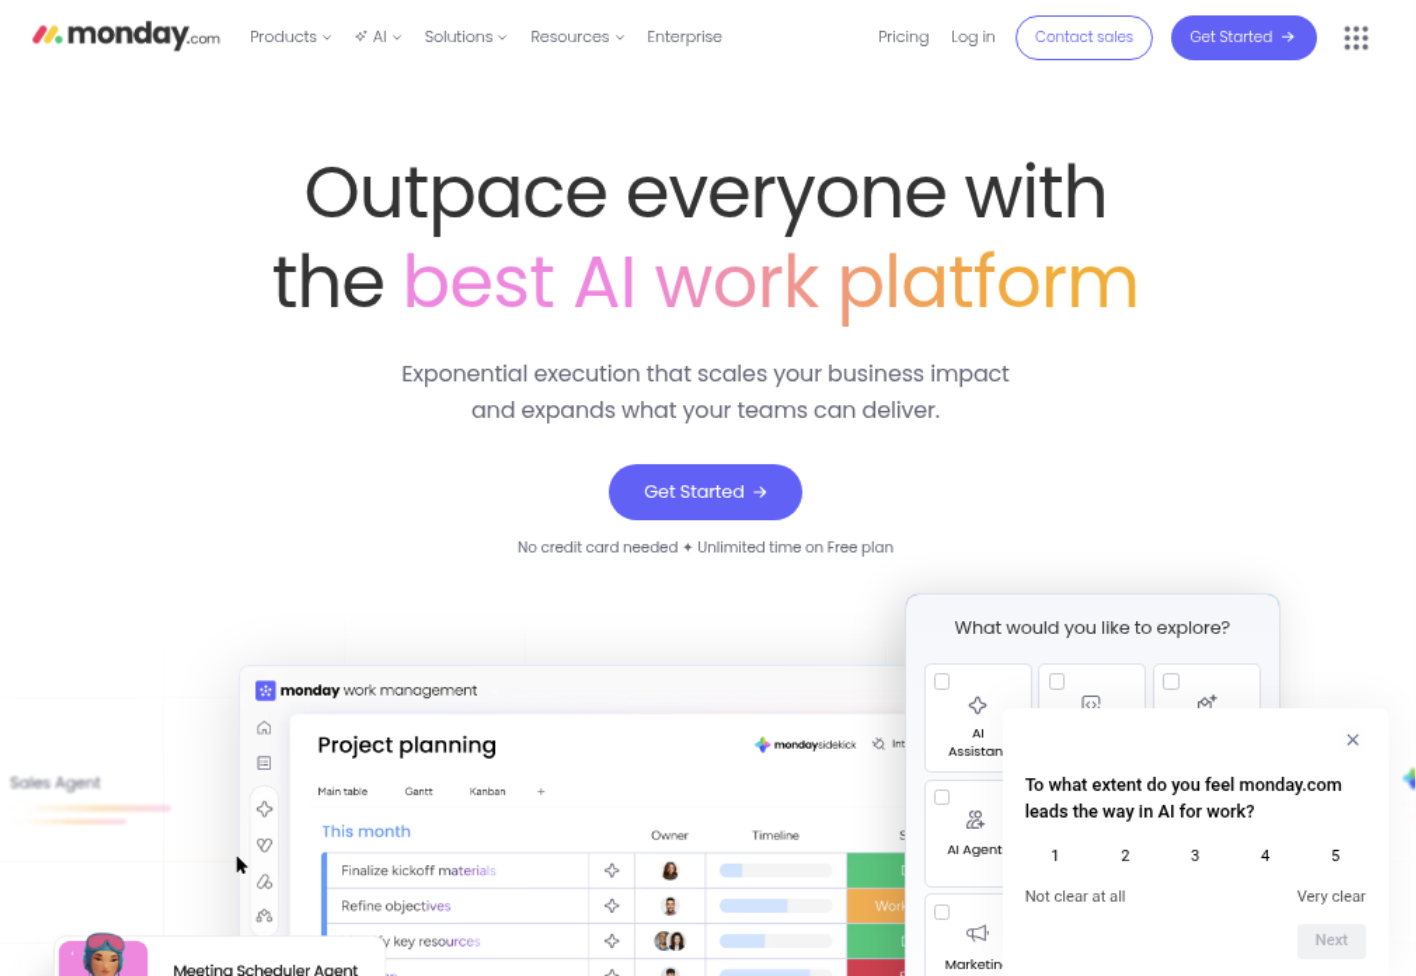
What You Can See in the Gantt View
The Gantt view places work across a calendar timeline. A bar represents the period between a task's start and finish dates.
- Tasks appear as horizontal timeline bars.
- Start and end dates show the expected duration.
- Dependency lines connect related activities.
- Milestones identify important project points.
- Groups can separate phases, teams, or workstreams.
- Status and ownership information can support progress tracking.
For example, a website redesign might include research, wireframes, visual design, development, testing, and launch. The chart can show that development starts after design approval and testing begins after a usable build exists.
What You Need Before Creating One
A useful Gantt chart needs more than task names. Add realistic dates, clear ownership, and meaningful relationships between activities before relying on the timeline.
- A project board with identifiable work items.
- Start dates and end dates for tasks with real duration.
- A person or team responsible for each activity.
- Dependencies for work that follows a defined sequence.
- Milestones for approvals, releases, or other major events.
- A consistent status system for tracking progress.
If every task has the same vague deadline, the chart may look polished while offering little planning value. A timeline becomes useful when it reflects how work actually happens.
How to Create a Gantt Chart in monday.com
-
Start with a project board
Create a new board or open an existing project board. Add one item for each meaningful task, deliverable, or phase.
For example, use “Approve homepage design” rather than “Design.” The more specific label makes the schedule easier to understand during status meetings.
-
Add date information
Add the dates your project needs. A start date and end date show duration, while a deadline column can identify the final commitment.
Use realistic estimates. If a task normally takes three working days, avoid giving it a one-day window simply to make the project appear faster.
-
Choose the Gantt view
Open the board's views area and add a Gantt view. Select the columns that should control the timeline, such as the task name, start date, end date, and status.
The exact menu labels may change as monday.com updates its interface. If you cannot see the option, check your account plan and board permissions.
-
Organize the timeline
Group activities by phase, department, release, or workstream. A product launch could use groups for planning, production, quality assurance, marketing, and launch day.
This structure helps you spot crowded periods. If testing and marketing preparation compete for the same specialists, the timeline can reveal the conflict early.
-
Add dependencies
Connect tasks that rely on earlier work. For instance, “Begin user acceptance testing” may depend on “Complete test build.”
Dependencies are especially useful when a date change should affect connected work. They can show the chain reaction created by a late activity.
-
Mark milestones
Use milestones for events that matter to the wider project. Examples include contract approval, beta release, customer sign-off, and public launch.
A milestone is different from a long activity. It represents a point in time, while a task usually occupies a period.
-
Review progress regularly
Update statuses, dates, and ownership as work changes. A Gantt chart becomes unreliable when nobody maintains it after the kickoff meeting.
During a weekly review, ask which tasks are late, which dependencies are at risk, and whether upcoming milestones still have credible dates.
Which monday.com Features Support Gantt Planning?
The Gantt view is only one part of the planning experience. Its value depends on how well it connects with the rest of your project board.
Timeline and date columns
Timeline columns show an activity across a range of dates. Date columns are useful for individual deadlines or point-in-time events.
Imagine a campaign with a two-week content production period and a single launch date. The timeline column can represent production, while the date column marks publication.
Dependencies
Dependencies help explain sequence. They answer questions such as, “What must finish before this task can begin?” and “Which activities could move if this date changes?”
They are valuable for construction planning, product development, marketing campaigns, and onboarding programs. However, they work best when your team maintains accurate relationships.
Milestones
Milestones provide visual checkpoints. A project manager can use them to show executive approvals, release dates, regulatory reviews, or customer commitments.
For example, a software team might place milestones at feature complete, code freeze, production release, and post-launch review.
Dashboards and reporting
Project dashboards can give stakeholders a broader view of schedule health, workload, and progress. A project lead may use the Gantt view for detailed planning and a dashboard for leadership updates.
The benefit is practical: engineers can focus on task-level activity while executives see major dates and overall progress.
Automations
Automations can reduce repetitive updates. A workflow might notify an owner when a deadline approaches or change a status after a date passes.
Use automation carefully. A notification can encourage action, but it cannot replace a conversation about an unrealistic estimate or missing requirement.
Gantt View Compared With monday.com Timeline and Calendar Views
monday.com provides several ways to view dates, but each view answers a different planning question.
| View | Best for | Key strength |
|---|---|---|
| Gantt | Sequenced project planning | Shows duration, dependencies, and milestones together |
| Timeline | Work across a date range | Provides a simpler visual schedule |
| Calendar | Deadlines and events | Shows activity by day, week, or month |
| Table-style board | Task management | Displays details, owners, statuses, and priorities |
A calendar may be enough for a content team tracking publication dates. A Gantt chart becomes more useful when the order and duration of work matter.
Consider an app release. A calendar can show the release date, but a Gantt chart can show the design, coding, testing, review, and deployment sequence leading to it.
When a monday.com Gantt Chart Works Well
A monday.com Gantt chart is a strong fit when your project has several connected activities and the team already manages work on monday.com boards.
Marketing campaigns
A campaign may include audience research, creative development, review, landing page preparation, email setup, and publication. Each stage has a different owner and may depend on an earlier approval.
The Gantt view makes the campaign's production path visible. If creative review slips by three days, the team can examine which launch activities are affected.
Product launches
Product launches often combine engineering, quality assurance, customer education, sales enablement, and public relations. A shared timeline can show where those workstreams meet.
For example, customer training may need a stable product build. The dependency makes that relationship visible instead of leaving it buried in a meeting conversation.
Client onboarding
Onboarding projects can include kickoff, access setup, configuration, training, review, and handover. The schedule helps the account team explain progress to the customer.
A clear timeline also makes ownership easier to discuss. If access setup is waiting on the client, the delay has a visible place in the plan.
Limitations to Consider Before Relying on It
Gantt charts are useful, but they do not automatically create a reliable project plan. You still need clear scope, realistic estimates, and consistent maintenance.
Plan availability can vary
Some monday.com views and advanced planning features may depend on your account plan, workspace settings, or permissions. Confirm current availability before designing a process around a specific feature.
For a small team, a basic timeline may meet the need. A larger organization may require more advanced dependencies, reporting, permissions, or portfolio planning.
Large projects can become crowded
A chart with hundreds of tasks is difficult to read. If every minor action appears on the same view, important milestones disappear among small activity bars.
Keep the main Gantt view focused on meaningful work. Use separate boards or grouped views for detailed execution when the project becomes too dense.
Dependencies require discipline
A dependency is only helpful when it reflects a real relationship. Connecting every task to the next can create a complicated chain that does not match how your team works.
For example, a legal review may be required before launch, while a social media draft can happen independently. Treating both as sequential could slow the plan unnecessarily.
Progress still needs human judgment
A completed status does not always mean the next team can begin. A developer may mark a feature complete while quality assurance still needs access, instructions, or test coverage.
Use the chart as a shared planning surface. Pair it with short conversations about risk, capacity, and changing priorities.
How to Build a More Reliable Project Timeline
The best results come from combining visual scheduling with simple planning habits.
Define the outcome first
Begin with the result the project must produce. A vague goal creates vague tasks, which creates a weak timeline.
Instead of “Improve onboarding,” define an outcome such as “Launch a self-service onboarding flow for new customers by September 15.”
Break work into usable units
A task should be small enough to estimate and large enough to matter. “Write five help articles” may be too broad if different specialists handle each article.
Break it into research, drafting, review, editing, and publishing when those activities have different owners or timing.
Estimate with evidence from past work
Use earlier projects to create reasonable ranges. If design reviews have taken two to four days in recent campaigns, avoid planning every review as an afternoon task.
Ranges can also support honest conversations. A team may commit to a target date while recognizing the risk around a longer estimate.
Protect major milestones
Milestones should represent decisions or deliverables that affect other people. Too many milestones reduce their meaning.
A useful project may have five meaningful checkpoints rather than thirty small markers.
Review the critical path
The critical path is the sequence of activities that determines the earliest possible finish. If one of those tasks slips, the final milestone may slip too.
During a weekly review, focus first on activities with little schedule flexibility. That gives you more time to respond before the deadline is threatened.
Natural Project Planning Solution: ONES.com
ONES.com combines project management and knowledge management in one platform, with ONES Project for project work and ONES Wiki for team knowledge. ONES Project can support teams looking for a Jira alternative with structured workflows, reporting, and timeline-oriented planning.

The platform is available through Cloud, On-Premise, Private Cloud, and Air-gapped deployments. The self-hosted versions provide feature parity with the cloud version, which can matter when your organization has strict hosting or network requirements.
Core Capabilities
Complex project schedules are difficult to coordinate → Gantt-oriented planning and dependencies → clearer delivery sequences
Teams can connect related activities, organize work into phases, and review milestone timing. This gives project leads a clearer view of how a late task could affect delivery.
Task details become scattered across planning views → Custom fields and structured work items → more consistent project information
Custom fields can capture priorities, teams, risk levels, environments, and release details. That makes filtering and reporting more useful than relying on task names alone.
Approval-heavy work changes from project to project → Custom workflows → repeatable movement from intake to completion
Teams can define statuses and transitions that match their process. A product request might move through triage, analysis, development, review, and release.
Teams spend too much time repeating routine updates → Automation → fewer manual handoffs
Automation can trigger notifications, update statuses, or assign follow-up actions when defined conditions occur. This helps reduce administrative work around common transitions.
Sprint work and long-term milestones compete for attention → Sprint management alongside broader planning → better connection between iteration and delivery
Agile teams can manage sprint activity while keeping sight of release goals. This helps connect daily execution with the larger project schedule.
Leadership lacks a consistent view of progress → Built-in reporting → faster status reviews
Reporting can help teams examine progress, workload, and project trends without assembling every update manually. A project manager can use detailed work views while leadership reviews summarized indicators.
Teams rely on many plugins for basic project needs → Native workflow, field, reporting, and automation features → fewer disconnected extensions
A Jira alternative is most useful when it covers core planning needs natively. ONES Project is designed to support Jira-compatible workflows while reducing dependence on multiple add-ons.
Restricted networks limit cloud-only planning tools → On-Premise, Private Cloud, and Air-gapped deployment options → more flexible governance
Organizations with security, compliance, or infrastructure requirements can choose a deployment model that fits their environment. This is particularly relevant for teams managing sensitive engineering or operational work.
Application Scenarios
Software delivery: A development team can connect requirements, sprint work, testing, approvals, and release milestones. Product leaders can review progress while specialists manage their own work queues.
Enterprise implementation: An implementation team can coordinate configuration, training, stakeholder reviews, and launch readiness. Custom workflows can reflect the client's approval process.
Restricted-network engineering: A team operating in an air-gapped environment can use a self-hosted deployment while retaining project planning, workflow, reporting, and sprint capabilities.
ONES.com offers 30 free seats, and ONES Project and ONES Wiki are sold separately. Review the current plan details and deployment requirements before selecting the platform for a large rollout.
Common Challenges and Practical Solutions
Challenge: The chart shows dates, but nobody trusts them
Solution: Set a weekly schedule review. Ask owners to confirm dates, explain changes, and identify risks before they affect milestones.
Challenge: The timeline contains too many minor tasks
Solution: Keep major deliverables in the primary view. Manage smaller actions in a supporting board or grouped workflow, then summarize their progress at the deliverable level.
Challenge: Dependencies create unnecessary delays
Solution: Add a dependency only when one activity genuinely relies on another. Check whether work can happen in parallel before creating a sequential relationship.
Challenge: Stakeholders interpret status differently
Solution: Define status meanings clearly. For example, “In progress” could mean active work has started, while “Ready for review” means the owner has completed the agreed acceptance criteria.
Challenge: The project changes after planning
Solution: Treat the timeline as a living plan. Record approved changes, adjust dates, and explain the effect on scope, resources, or milestones.
FAQs About monday.com Gantt Charts
Can I make a Gantt chart in monday.com?
Yes. You can add a Gantt view to a project board and connect it to relevant task, date, status, and dependency columns. The chart then displays activities across a timeline. Availability and advanced capabilities can vary by plan and permissions, so check your current monday.com account details before building a company-wide process.
Does monday.com support task dependencies?
Yes, monday.com supports dependencies for connecting activities that follow a defined sequence. For example, testing can depend on development finishing first. Dependencies are most effective when dates and relationships are maintained regularly. They should represent genuine constraints, rather than linking every task simply because it appears nearby in the workflow.
Can monday.com Gantt charts show milestones?
Yes. You can use milestones to highlight important points such as approvals, launches, releases, or customer handoffs. Milestones help stakeholders scan the schedule quickly. Keep them focused on significant events, because marking every small activity as a milestone makes the view harder to interpret.
Is a Gantt chart better than a calendar view?
It depends on the planning question. A calendar view is useful for seeing deadlines and events by day or month. A Gantt chart is better when you need to understand task duration, sequencing, dependencies, and milestone risk. A marketing team tracking publication dates may need only a calendar, while a product launch usually benefits from a connected timeline.
Why is my Gantt chart difficult to read?
Most readability problems come from too many tasks, inconsistent dates, or unclear grouping. Start with major deliverables and phases, then add detail only when it helps a planning decision. Group work by team or project stage, use meaningful task names, and maintain the chart during regular reviews. A focused chart usually provides more value than a complete but crowded one.
Conclusion
Yes, monday.com has Gantt charts through its Gantt view and related timeline planning features. You can use them to display task duration, connect dependencies, mark milestones, and monitor project progress.
The feature works best when your board contains clear tasks, realistic dates, named owners, and carefully chosen relationships. A Gantt chart can reveal schedule risk early, but it cannot repair unclear scope or neglected updates.
But here's the truth: the visual timeline is only the solution when it reflects real project behavior. Start with the outcome, build manageable work items, protect key milestones, and review the plan consistently.
If you need a broader project management environment, ONES.com provides ONES Project as a Jira alternative with custom workflows, reporting, sprint management, automation, and flexible deployment options. Choose the planning approach that matches your team's complexity, governance needs, and working habits.