Does Google Have a Gantt Chart? A 2026 Guide to Options
Planning a project with scattered dates, tasks, and deadlines can become confusing quickly. Google gives you familiar tools, yet finding a true Gantt chart inside Google Workspace is less straightforward.
You can build a timeline in Google Sheets, install an add-on, or connect another project platform. Each option handles dependencies, progress tracking, and collaboration differently. Choosing the wrong approach may leave you maintaining colored cells instead of managing the work itself.
But here’s the truth: Google does not offer a dedicated, native Gantt chart app. You can still create Gantt-style timelines with Google Sheets templates, add-ons, or external tools that connect with Google Workspace.
Does Google Have a Gantt Chart?
Google does not have a dedicated native Gantt chart tool. You can create a Gantt-style schedule in Google Sheets, use a third-party add-on, or manage projects in another platform with Google integrations.
A Gantt chart displays tasks across a calendar timeline. Each task appears as a horizontal bar showing its start date, duration, and expected finish date.
For example, a website launch may include research, design, development, testing, and release. A Gantt chart shows when each activity starts and how the activities overlap.
Google offers several ways to approximate this experience:
- Google Sheets templates for manually creating timeline bars
- Third-party add-ons that generate Gantt-style views
- Google Calendar for deadline and event scheduling
- Google Tasks for personal task reminders
- External project management platforms with Google Workspace connections
Here’s why the distinction matters: a formatted timeline is not always a complete project management workflow. Advanced Gantt charts can show dependencies, milestones, resource assignments, progress, baselines, and schedule changes.
What Google Sheets Can Do
Google Sheets can represent a project schedule with task names, owners, start dates, end dates, and calculated durations. Conditional formatting can then color cells across a calendar range.
For example, a formula can compare each calendar date with a task’s start and finish dates. When the date falls within that range, the cell receives a color.
This approach works well for a small marketing campaign with ten tasks and one project owner. It becomes harder to maintain when several people update dates or when tasks depend on one another.
What Google Sheets Usually Lacks
A manually built timeline generally requires extra work for dependency management. If a design task moves three days later, related development and testing dates may not shift automatically.
You may also need separate formulas for progress, milestones, overdue work, and schedule variance. Each addition increases the chance of an incorrect formula or inconsistent formatting.
The result can resemble a Gantt chart visually while lacking the controls that make project scheduling useful.
How to Create a Gantt Chart in Google Sheets
You can build a practical timeline in Google Sheets with five steps. This method suits straightforward projects with stable dates and limited dependencies.
1. Create the Project Schedule Columns
Start with columns for the information your team needs to manage the schedule.
- Task name
- Task owner
- Start date
- End date
- Duration
- Progress
- Status
For example, your first task might be “Approve homepage design.” Assign an owner, add the start and end dates, then choose a status such as “In progress.”
2. Add a Calendar Across the Top
Place calendar dates in columns to the right of the task details. You can use daily columns for short projects or weekly columns for longer programs.
A daily view works well for a two-week product release. A weekly view provides a cleaner layout for a six-month construction or business transformation program.
3. Calculate Task Duration
Use a simple date calculation to show the number of calendar days between the start and finish dates.
For example, subtract the start date from the end date and add one if you want to count both boundary dates. Format the result as a number.
Check the result with a familiar example. A task running from Monday through Wednesday should show three days when weekends are included.
4. Apply Conditional Formatting
Use conditional formatting to color calendar cells when their dates fall between a task’s start and end dates.
The logic compares each calendar heading with the two task dates. When the calendar date is within that range, the cell receives the selected fill color.
Use different colors carefully. One color for planned work, another for completed work, and a third for overdue work can improve readability.
5. Add Milestones and Review Rules
Milestones represent important checkpoints, such as an approval, launch, inspection, or payment.
You can mark milestones with a symbol, a distinct color, or a task with identical start and finish dates. Add a review rule for overdue tasks and dates that fall on nonworking days.
Before sharing the timeline, test several scenarios. Move one task later, change its owner, and update its progress. Check whether the visual schedule still communicates the correct status.
When a Google Sheets Timeline Works Well
A Sheets-based Gantt chart can be a sensible choice when your project is small, the schedule changes rarely, and the team already works comfortably in Google Workspace.
Imagine a community event with twelve planning activities. One coordinator manages the schedule, five volunteers need visibility, and most tasks have clear start and finish dates.
In that situation, a simple timeline may provide enough clarity. You can share it quickly, add comments, and review it during a weekly meeting.
Google Sheets also works for early planning. A team may sketch a rough release calendar before selecting a more structured project system.
Signs That Sheets Is Enough
- The project has fewer than twenty or thirty major tasks
- Only a few people edit the schedule
- Dependencies are easy to explain manually
- Progress updates happen during regular meetings
- You need a lightweight visual plan rather than full project control
The best part? You can start without training the entire team on a new interface. A simple, readable schedule often beats a sophisticated system nobody updates.
When You Need More Than a Google Timeline
A manually maintained Gantt chart becomes less suitable as complexity grows. The main warning signs involve dependencies, frequent changes, multiple teams, and detailed reporting.
Consider a software release involving design, engineering, security, legal review, and customer support. If security approval delays the release, several later activities may need new dates.
Changing those dates by hand creates administrative work. It can also hide the real effect of the delay from people who rely on the schedule.
Common Complexity Signals
- Tasks depend on other tasks finishing first
- Several teams share the same specialists
- Dates change multiple times each week
- You need baselines or planned-versus-actual comparisons
- Managers need dashboards or portfolio views
- People need to update work without editing formulas
- You need an audit trail for schedule changes
Here’s the practical test: if maintaining the chart takes longer than reviewing the project, the chart has become part of the problem.
Dependencies Change the Decision
Dependencies describe relationships between tasks. For example, testing may depend on a completed build, while a public announcement may depend on approved testing results.
A basic timeline can display these relationships through notes or arrows. A project management platform can connect tasks and calculate schedule effects more directly.
This difference matters when a single delay affects ten later activities. A connected workflow reduces the need to recalculate every date manually.
Google Gantt Chart Options Compared
You have four practical choices. The right option depends on project complexity, collaboration needs, and how much schedule automation you need.
| Option | Best for | Main advantage | Main limitation |
|---|---|---|---|
| Google Sheets template | Small projects and simple planning | Familiar and quick to customize | Manual dependency and progress management |
| Sheets add-on | Teams wanting extra timeline functions | Adds scheduling features within a familiar environment | Quality, permissions, and pricing vary |
| Google Calendar and Tasks | Personal deadlines and appointments | Strong date reminders and calendar visibility | Limited project dependencies and workload planning |
| Project management platform | Cross-functional and complex projects | Connected tasks, reporting, automation, and ownership | Requires setup, governance, and team adoption |
Google Sheets Templates
Templates reduce setup time because they provide task columns, date fields, and a calendar layout. You still need to inspect formulas and adjust the design for your workflow.
Before sharing a template, test date changes and duplicate tasks. A polished appearance does not guarantee that every calculation works for your project.
Third-Party Add-Ons
Add-ons can extend Google Sheets with timeline views, task synchronization, or planning features. They may suit teams that prefer staying inside Google Workspace.
Review permissions before installation. Check what information the add-on can access, how updates are handled, and whether the provider supports your required Workspace edition.
Calendar and Task Tools
Google Calendar is useful for meetings, deadlines, and time-specific events. Google Tasks can help individuals remember assigned activities.
Neither tool is designed to replace a full dependency-driven project schedule. They work best as supporting tools for personal planning and team visibility.
How to Choose the Right Approach
Start with the project’s coordination needs rather than the visual style you prefer. A Gantt chart is valuable because it clarifies timing, responsibility, and sequence.
Ask how many tasks exist, how often dates change, who owns updates, and whether one delay affects several teams.
Use This Decision Checklist
- Choose Google Sheets when the schedule is small and mostly manual.
- Consider an add-on when you need more timeline behavior inside Sheets.
- Use Calendar and Tasks for reminders, meetings, and personal commitments.
- Choose a project platform when dependencies and reporting drive the work.
You might be wondering: should you start with the simplest option? Usually, yes, if you define a clear upgrade point.
For example, move beyond Sheets when you have more than one schedule coordinator, weekly date changes, or repeated missed handoffs.
Evaluate the Team Workflow
A tool should match how your team actually works. If people discuss tasks in meetings but rarely update a planning grid, automation and ownership controls may matter more than visual flexibility.
Ask three people to update a trial schedule. Watch where they hesitate. Their questions often reveal more than a feature checklist.
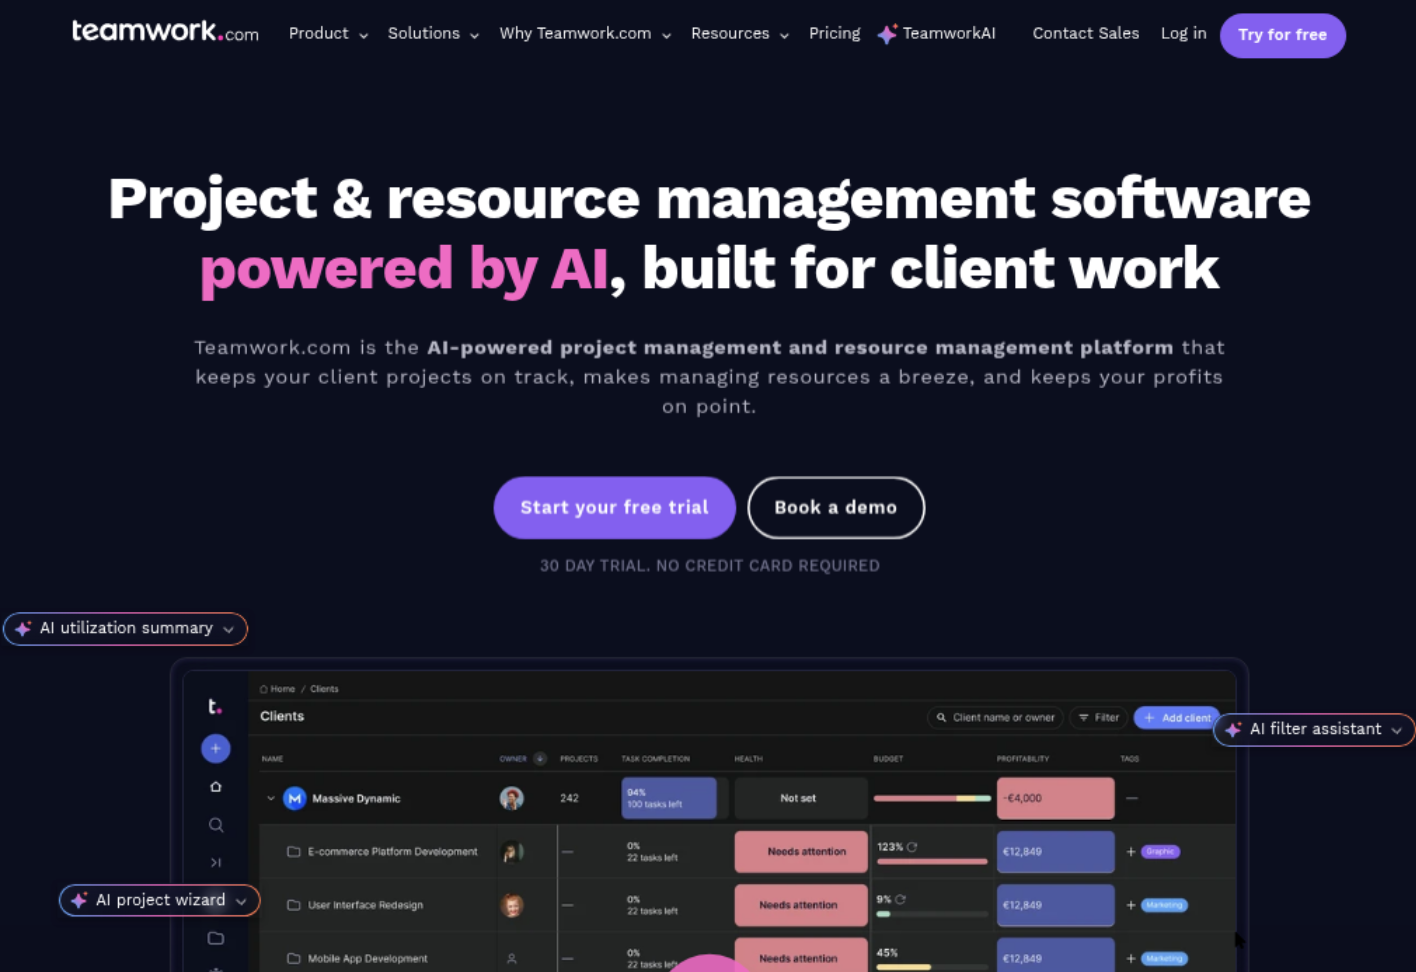
Natural Gantt Chart Solution: ONES.com

Value Proposition
ONES.com combines project management and knowledge management in one platform. ONES Project provides a structured alternative to Google Sheets for teams that need connected planning, execution, and reporting.
It supports cloud, on-premise, private cloud, and air-gapped deployments. A free plan supports up to 30 seats, and the self-hosted versions maintain feature parity with the cloud version.
Core Capabilities
- Scattered schedules: ONES Project centralizes tasks, owners, dates, and status updates, giving the team one working view.
- Manual dependency tracking: Connected workflows help teams manage task relationships and understand how schedule changes affect later work.
- Inconsistent project fields: Custom fields let you capture release type, risk, department, priority, or approval stage.
- Rigid processes: Custom workflows adapt task states to your real process, such as design review, security approval, and release readiness.
- Unclear sprint planning: Sprint management helps agile teams organize planned work, active work, and completed outcomes.
- Repeated administrative steps: Automation can reduce routine transitions, notifications, and assignment actions.
- Limited reporting: Built-in reporting provides visibility into progress, workload, status, and delivery trends.
- Plugin-heavy project setups: Jira-compatible workflows support teams familiar with Jira-style planning while reducing dependence on multiple extensions.
- Restricted-network requirements: On-premise, private cloud, and air-gapped deployment options support environments with strict infrastructure controls.
- Scattered project knowledge: ONES Wiki gives teams a connected knowledge management space alongside project work.
The result is a project environment where the timeline connects to execution. You can move beyond coloring calendar cells and track the work behind each schedule bar.
Application Scenarios
Software release planning: A product team can connect sprint work with testing, security review, documentation, and release tasks. Managers can review progress without rebuilding a separate timeline.
Hardware development: Engineering, procurement, manufacturing, and quality teams can use custom workflows for approvals and stage gates. On-premise deployment can support internal infrastructure requirements.
Air-gapped project operations: A restricted-network team can run project and knowledge workflows in an air-gapped environment. The team retains structured planning without moving sensitive work into a public cloud.
Common Challenges
Challenge: The Timeline Looks Right but the Dates Are Wrong
Color formatting can make a schedule appear polished even when formulas contain errors. A wrong date range may hide a delay or show work continuing after completion.
Solution: Test the timeline with known examples. Change one start date, one end date, and one status before relying on the view.
Challenge: Too Many People Edit the Planning Grid
Multiple editors may overwrite formulas, change formats, or enter dates inconsistently. The chart then becomes difficult to trust.
Solution: Protect formula ranges, define editing responsibilities, and use consistent date formats. Assign one schedule owner for structural changes.
Challenge: Dependencies Are Hidden
A row-by-row schedule may show dates without explaining why one task must wait for another. Stakeholders can then request changes without seeing the consequences.
Solution: Add predecessor fields and review relationships during planning. For complex work, use a platform that connects dependencies directly.
Challenge: The Chart Becomes Too Wide
Daily columns can make a long project difficult to read. People may scroll past important task details or lose the overall schedule view.
Solution: Use weekly columns for long programs and daily columns for short execution windows. You can also maintain a summary timeline beside a detailed schedule.
Challenge: People Stop Updating the Schedule
A timeline loses value when task status and dates become stale. This often happens when updates require manual calculations or duplicate work.
Solution: Set a recurring update routine. Ask each owner to confirm status, remaining work, and the next milestone before the weekly review.
FAQs
Can I make a Gantt chart for free with Google Sheets?
Yes. You can create one with task columns, calendar dates, formulas, and conditional formatting. Google Sheets templates may reduce setup time.
The approach works best for simple projects. You may need another platform when dependencies, approvals, workload planning, or frequent schedule changes become important.
Does Google Docs include a Gantt chart feature?
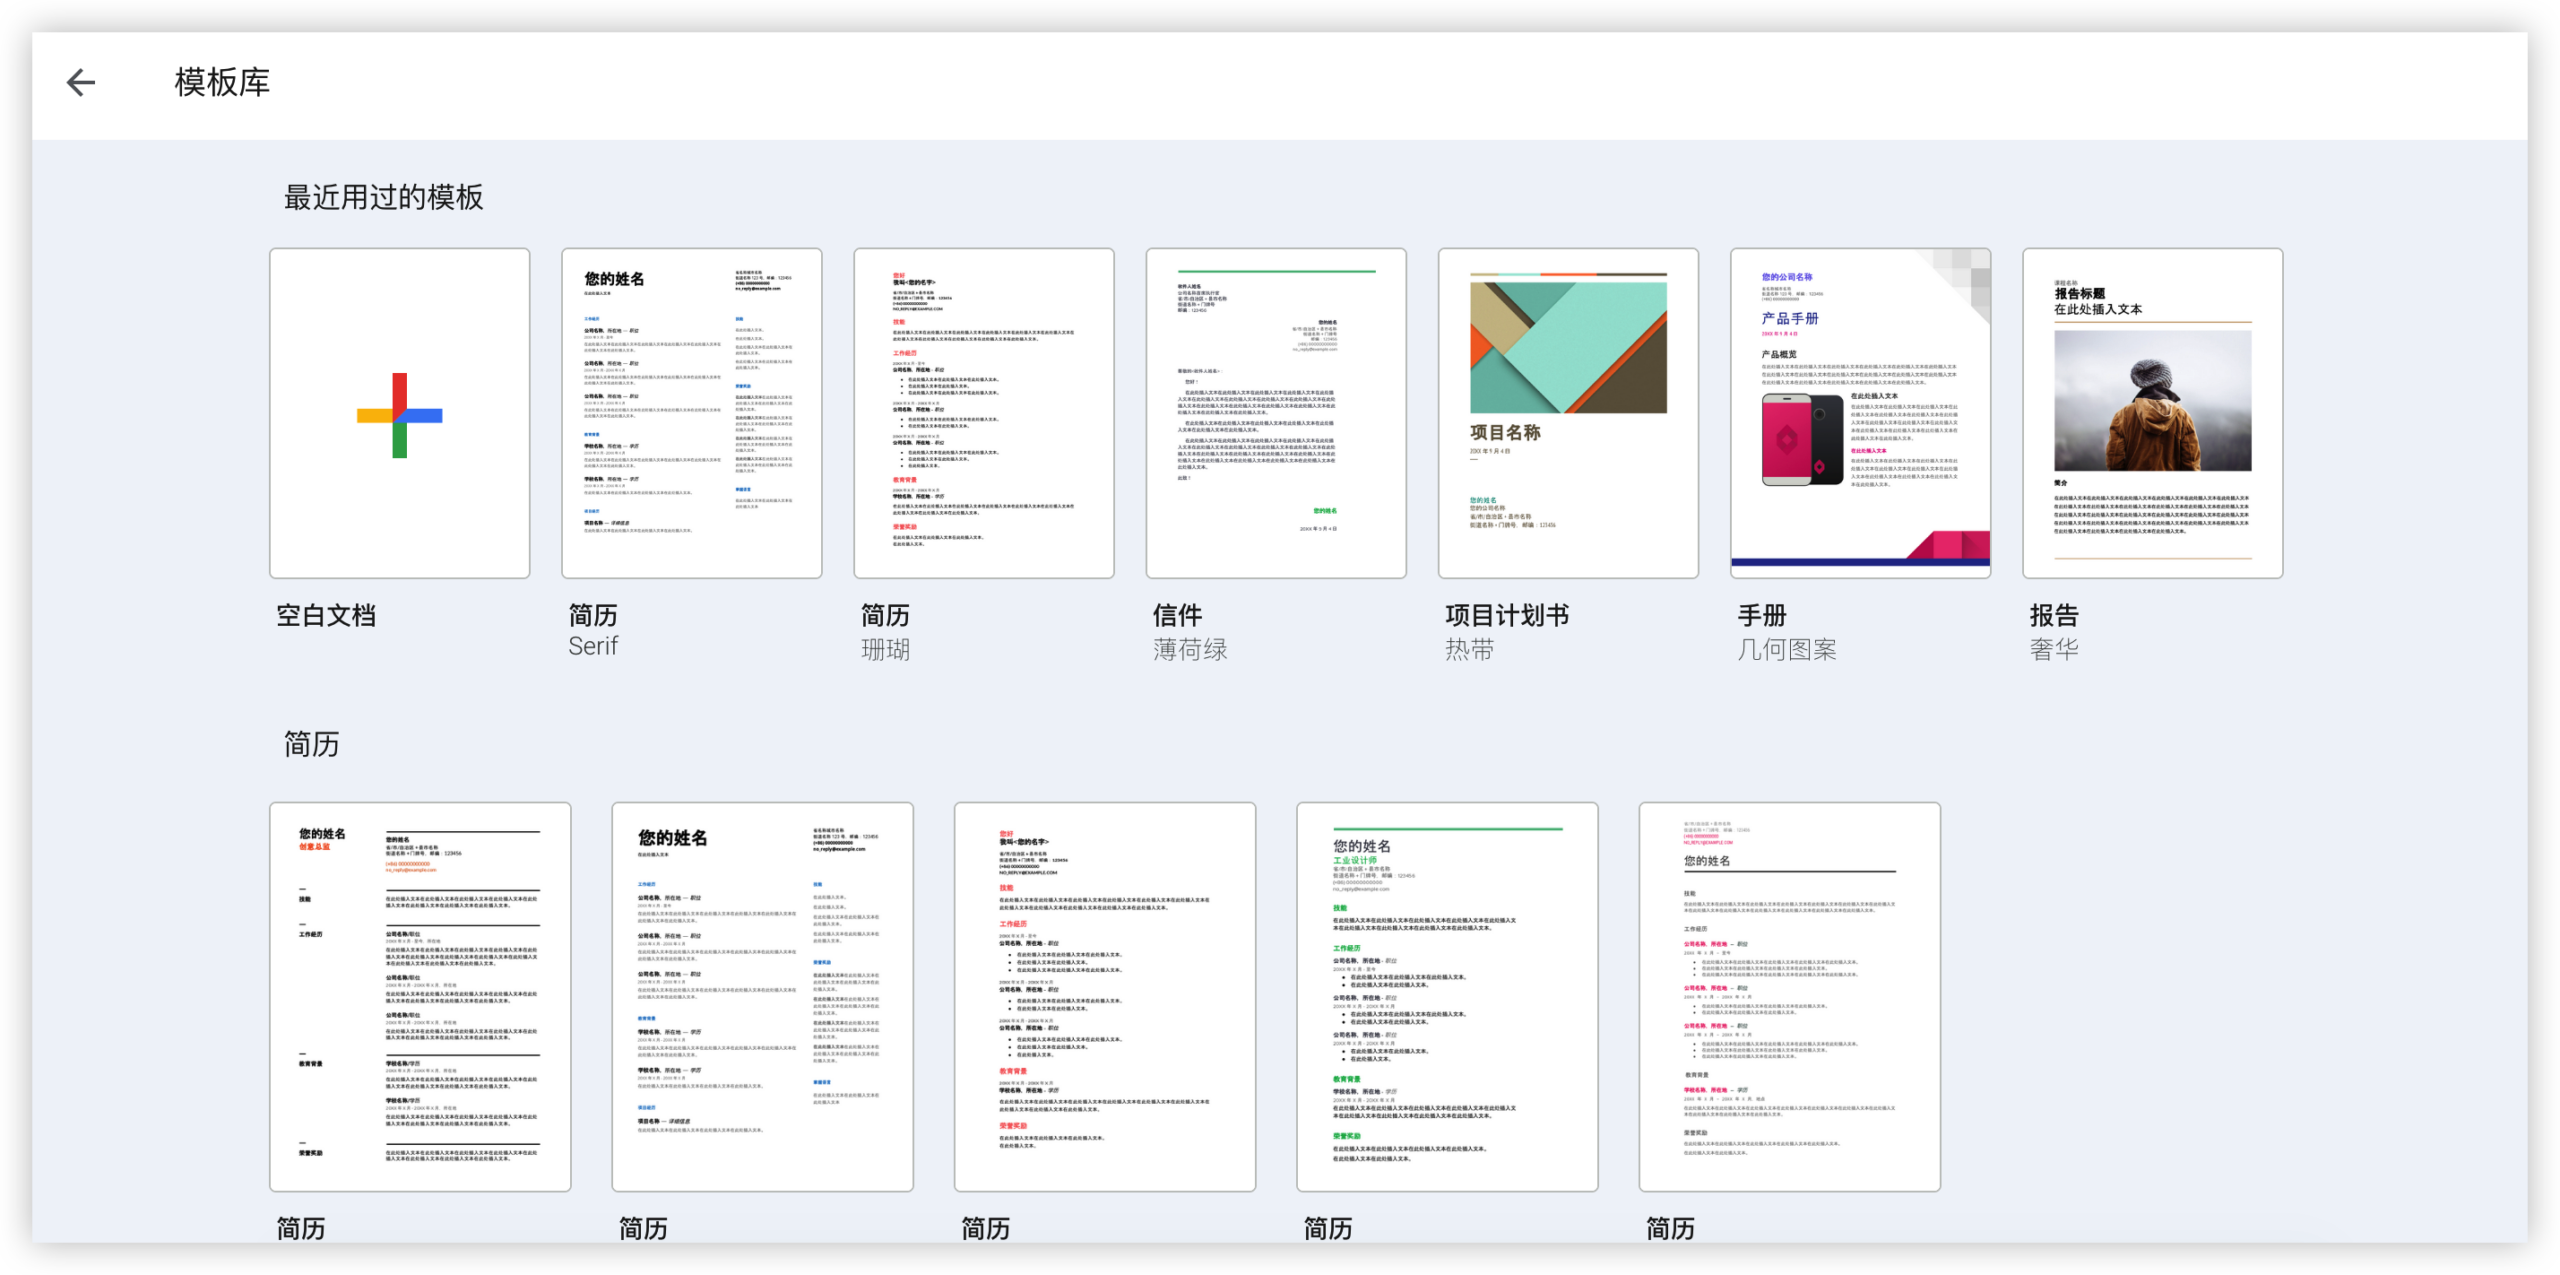
Google Docs does not include a native Gantt chart feature. You can add a manually created timeline as an image or link to a Google Sheets schedule.
That method helps with written plans, yet the timeline remains easier to maintain in a planning tool rather than inside a text editor.
Can Google Calendar replace a Gantt chart?
Google Calendar can manage meetings, deadlines, and time-specific commitments. It does not provide the same project view as a dependency-driven Gantt chart.
Calendar works well beside a project schedule. Use it for appointments and reminders, while the project system tracks task sequence and delivery progress.
Are Google Sheets Gantt charts collaborative?
Yes. Multiple people can collaborate on a Google Sheets timeline, add comments, and review updates. However, collaboration does not automatically create dependency management or schedule automation.
Protect formulas and establish editing rules before inviting a large group. Otherwise, accidental changes can affect the visual schedule.
When should I move from Google Sheets to project management software?
Consider moving when the project has frequent date changes, cross-team dependencies, repeated approvals, or a need for detailed reporting.
A useful trigger is repeated manual rework. If you spend each planning meeting repairing the timeline, a connected project workflow may provide better control.
Is a Gantt chart useful for agile teams?
It can be useful for release planning, cross-team coordination, and milestone visibility. Agile teams often combine a high-level timeline with sprint boards and daily task tracking.
Use the Gantt view for longer-term sequencing. Use sprint planning for near-term execution and team commitments.
Conclusion
Google does not provide a dedicated native Gantt chart application. You can create a Gantt-style timeline in Google Sheets, extend Sheets with an add-on, or use Calendar for simpler deadline planning.
Start with Sheets when your project is small and stable. Choose a structured project platform when dependencies, reporting, automation, or restricted deployment requirements shape the work.
But here’s the truth: a colored timeline only helps when the dates and responsibilities stay reliable. Define ownership, test your formulas, and set a clear point for upgrading your workflow.
For teams that need more connected planning, ONES.com offers ONES Project, ONES Wiki, custom workflows, reporting, automation, sprint management, and several deployment choices. The right approach gives you more than a chart; it gives you a clearer way to deliver the project.