Does ClickUp Have a Gantt Chart? A 2026 Guide for Teams
Planning a complex project without a timeline view can quickly create confusion. Tasks may have owners and due dates, yet nobody can see how work connects, where delays begin, or which milestone is at risk.
That gap becomes painful when several teams share dependencies. A two-day delay in design can quietly push development, testing, and launch dates with it. A basic task list rarely makes that chain obvious.
But here's the truth: ClickUp does have a Gantt chart. You can use it to map tasks across time, connect dependencies, track milestones, and adjust schedules visually. This guide explains where to find it, what it can do, which limitations to consider, and how it compares with another project management option.
Does ClickUp Have a Gantt Chart?
Yes, ClickUp includes a Gantt Chart view for visualizing project schedules, task durations, milestones, and dependencies on a horizontal timeline.
The view turns a task list into a schedule. Each task appears as a bar, its length represents the planned duration, and lines can connect related tasks. You can then spot overlapping work, delayed activities, and upcoming milestones more easily.
Here's why that matters: a project schedule is easier to manage when you can see both individual tasks and their relationships. For example, a website launch may include these linked activities:
- Approve page structure
- Write landing page copy
- Complete visual design
- Build the page
- Run quality checks
- Publish the release
If design finishes late, the Gantt chart helps you see which later activities may also move. That visibility supports faster decisions than scanning dozens of task rows.
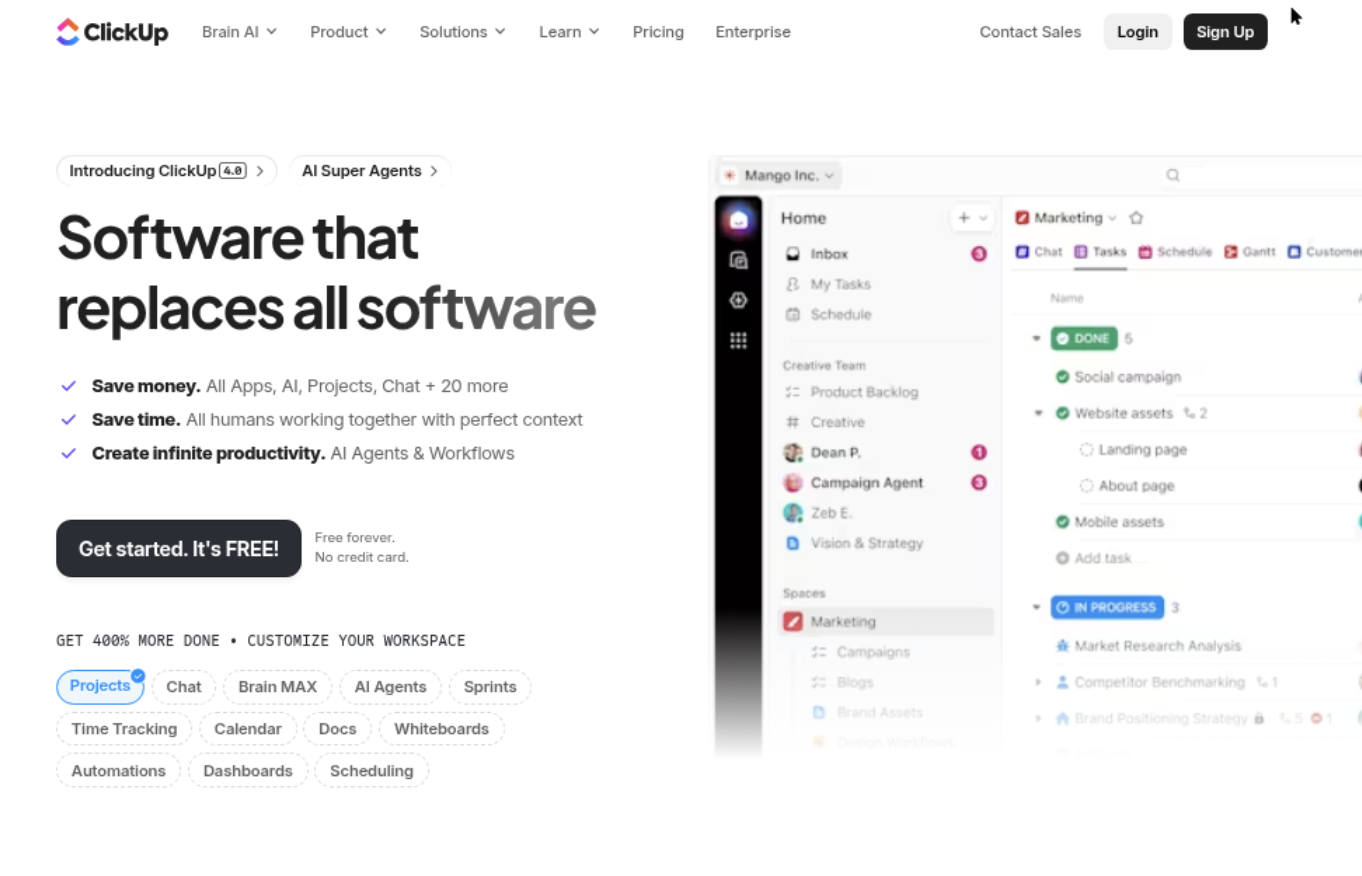
What the ClickUp Gantt view can show
ClickUp’s timeline view is designed for projects that need scheduling and dependency management. Common elements include:
- Task start and due dates
- Task duration
- Milestones
- Task dependencies
- Lists, folders, and project groupings
- Progress indicators
- Assignees and task status
- Critical paths or schedule-sensitive work, where supported by the workspace setup
The exact experience can depend on your ClickUp plan, workspace permissions, and current product configuration. Check your workspace plan when a feature appears unavailable.
How to add a Gantt chart in ClickUp
- Open the relevant ClickUp space, folder, or list.
- Select the option to add a new view.
- Choose Gantt from the available view types.
- Name the view if your team needs several schedule perspectives.
- Set task start dates and due dates.
- Add dependencies between activities that must happen in sequence.
- Group tasks by list, status, assignee, or another useful category.
- Review the timeline and adjust dates as the project changes.
Let me explain the most important setup detail: a Gantt chart becomes useful only when dates and dependencies are maintained. Adding the view alone does not create a reliable project schedule.
How ClickUp’s Gantt Chart Works in Practice
ClickUp’s Gantt chart uses task scheduling information to create a visual project timeline. You can zoom between broader planning periods and shorter working windows, depending on the level of detail you need.
For example, a product team might review the entire quarter during a leadership meeting. The same team could zoom into one week when checking whether testing can begin after development finishes.
Tasks, subtasks, and milestones
Tasks usually represent planned work, while subtasks break larger activities into smaller deliverables. Milestones mark important events such as beta approval, contract signing, or public launch.
A practical structure might look like this:
- Task: Prepare mobile application release
- Subtask: Complete regression testing
- Subtask: Resolve high-priority defects
- Subtask: Prepare release notes
- Milestone: Release candidate approved
This hierarchy helps you communicate at two levels. Executives can focus on milestones, while delivery teams can work through the detailed activities underneath them.
Dependencies and scheduling logic
Dependencies describe relationships between tasks. A finish-to-start relationship means one activity should finish before another begins.
For example, a testing task may depend on a completed build. If the build moves, the testing schedule may need to move too. Connecting those tasks makes the relationship visible.
Common dependency patterns include:
- Finish to start: testing begins after development ends.
- Start to start: two activities begin around the same time.
- Finish to finish: two activities are planned to finish together.
Use dependencies for meaningful relationships rather than every possible connection. Too many links can make the timeline harder to read and encourage unnecessary schedule changes.
Progress tracking on the timeline
A Gantt view can help you compare planned timing with current progress. Status labels, completion indicators, and date changes show whether work is moving as expected.
Imagine a campaign with ten tasks. Eight are complete, one is active, and one has not started because a review is late. A timeline makes that bottleneck easier to identify than a long list of task names.
What You Need Before Building a Reliable Schedule
A Gantt chart reflects the quality of your planning. If every task has an arbitrary deadline, the visual timeline may look organized while hiding serious scheduling problems.
Here's why: a chart can display weak assumptions very neatly. Before creating one, clarify the work, ownership, timing, and relationships that matter.
Define the project outcome
Start with a clear result. “Improve onboarding” is broad, while “Launch the new onboarding flow for all new accounts” gives the team a more useful target.
A defined outcome helps you decide which tasks belong in the schedule. It also prevents unrelated activities from crowding the timeline.
Estimate task durations realistically
Estimate active work separately from waiting time. A designer may need two days to create a layout, but approval could take another three business days.
Include reviews, handoffs, testing, and revisions. These activities often create the longest delays because teams forget to plan for them.
Assign ownership
Every important activity needs a clear owner. Shared responsibility can sound collaborative, yet it often creates uncertainty when a deadline approaches.
For example, assign one person to coordinate launch readiness, even if engineering, marketing, and support each own separate tasks.
Record real dependencies
Ask a simple question: “What must happen before this work can begin?” The answer identifies a likely dependency.
Do not connect tasks merely because they appear in the same project. A content review may depend on final copy, while a technical discussion may happen independently.
ClickUp Gantt Chart Benefits and Limitations
ClickUp’s Gantt view can be valuable when your team needs one place to manage tasks and timelines. It is especially useful for projects with several stages and clear task relationships.
Where the view works well
- Cross-functional planning: teams can see how marketing, design, engineering, and operations work fits together.
- Milestone management: leaders can monitor major approval points and launch dates.
- Dependency visibility: coordinators can identify work that may block later activities.
- Schedule communication: a visual timeline can make project reviews easier to understand.
- Change management: moving one activity can prompt a review of related dates.
For example, a construction marketing campaign may include creative development, legal review, channel setup, and launch preparation. A timeline makes the handoffs visible without requiring everyone to inspect every task.
Where you may need caution
A Gantt chart can become crowded when a team places every small action on one timeline. Hundreds of tiny tasks may create visual noise instead of clarity.
It can also become unreliable when people do not update dates or statuses. A schedule showing last month’s assumptions may look precise while misleading the team.
You should also confirm plan availability and permissions. ClickUp changes features and packaging over time, so your workspace may not match an older tutorial.
When another planning view may be better
A Gantt chart is not the best view for every type of work. A board can be easier for monitoring workflow stages, while a calendar may suit content publishing.
Use the Gantt view when time relationships matter. Use a different view when your main question concerns status, workload, priorities, or recurring work.
ClickUp Gantt Chart Compared With Other Planning Views
Choosing a view depends on the question you need to answer. The same project may benefit from several views because each one emphasizes a different dimension of work.
| Planning view | Best for | Example question |
|---|---|---|
| Gantt chart | Dependencies and project timing | Will a delayed design task affect the launch? |
| Board view | Workflow stages | Which tasks are waiting for review? |
| Calendar view | Date-based commitments | What must the team publish this week? |
| List view | Detailed task review | Who owns each open activity? |
| Workload view | Capacity planning | Which person has too much assigned work? |
The best part? You do not need to choose one view permanently. A project manager may use Gantt for planning, a board for daily coordination, and a workload view for staffing discussions.
For example, suppose a product launch is scheduled for June 30. The Gantt view shows whether preparation fits the calendar. The workload view shows whether the assigned team can handle it. The board shows what needs attention today.
How to Use a Gantt Chart Without Creating False Confidence
A polished timeline can create a false sense of control. The chart should support conversations, decisions, and updates rather than replace them.
Review schedule health regularly
Set a recurring review, such as every Monday morning. Check overdue tasks, blocked work, new risks, and changes to major milestones.
During the review, ask:
- Which task is now the biggest schedule risk?
- Which dependency has changed?
- Does any owner need help or a decision?
- Should a milestone move?
- Which dates are fixed, and which dates remain flexible?
Separate commitments from estimates
A target date may be a rough estimate, while a customer launch date may be a firm commitment. Marking both the same way can confuse the team.
Keep firm deadlines visible and label internal estimates clearly. This distinction helps people prioritize the dates that genuinely carry consequences.
Build in reasonable flexibility
Projects rarely progress in a perfectly straight line. Include time for review cycles, defect correction, approvals, and unexpected coordination.
For instance, a two-week development period may require an additional review window before release. Treating that window as part of the plan produces a more credible schedule.
Keep the timeline readable
Group related work, hide unnecessary detail during leadership reviews, and use milestones to create visual landmarks. A readable chart encourages people to use it.
If the timeline requires a long explanation before anyone understands it, simplify the structure or create a focused view for that audience.
Natural Project Scheduling Solution: ONES.com
ONES.com is a unified platform for project management and knowledge management. ONES Project provides project planning capabilities, while ONES Wiki supports team knowledge management. They are sold separately.

For teams evaluating a Jira alternative, ONES Project combines Jira-compatible workflows with native planning, reporting, automation, and deployment flexibility. That can help teams manage schedule-driven work without assembling many separate plugins.
Value Proposition
ONES.com helps teams connect structured project execution with organized team knowledge. ONES Project is available in Cloud, On-Premise, Private Cloud, and Air-gapped deployments, with feature parity between cloud and self-hosted versions.
Core Capabilities
- Scattered task planning → ONES Project’s structured project spaces → teams can organize work across projects, folders, lists, and delivery stages.
- Unclear project timing → timeline and schedule planning → coordinators can review task dates, milestones, and dependencies in one planning environment.
- Rigid processes → custom workflows and fields → teams can adapt statuses, required details, and approval steps to their operating model.
- Heavy plugin dependence → native reporting and project features → teams can reduce the number of separate extensions needed for progress reviews.
- Manual repetitive coordination → automation → routine status changes, assignments, and notifications can follow defined rules.
- Inconsistent sprint execution → built-in sprint management → agile teams can plan iterations, track work, and review progress within the same project environment.
- Migration concerns for Jira teams → Jira-compatible workflows → teams familiar with Jira-style planning can preserve recognizable delivery patterns while evaluating another platform.
- Restricted network requirements → On-Premise, Private Cloud, and Air-gapped deployment options → organizations with strict infrastructure rules can choose a deployment model that fits their environment.
- Separate project and knowledge systems → ONES.com’s unified platform approach → teams can connect delivery activity with operational knowledge when both products are adopted.
Application Scenarios
Software release planning: A development team can map epics, sprints, testing activities, approvals, and release milestones. Dependencies make it easier to see whether unfinished engineering work threatens validation.
Regulated internal operations: A team with restricted network requirements can evaluate an air-gapped or self-hosted deployment. Project schedules, custom approval flows, and reporting can remain within its controlled environment.
Jira alternative evaluation: A growing team can compare workflow flexibility, native reporting, sprint support, and deployment choices. It can assess whether fewer plugins would simplify administration and maintenance.
Common Challenges With Gantt Chart Planning
Challenge: Dates are missing or inconsistent
Solution: Define a minimum scheduling standard. Every major task should have an owner, start date, due date, and status. Add dependencies only when they affect delivery order.
Challenge: The chart becomes too crowded
Solution: Keep the main view focused on major deliverables and schedule-sensitive work. Use subtasks for detail, then create separate views for specific teams or phases.
Challenge: People treat estimates as promises
Solution: Mark firm commitments separately from working estimates. Discuss confidence during schedule reviews and revise dates when assumptions change.
Challenge: Dependencies do not reflect reality
Solution: Ask task owners to validate each important relationship. A dependency should represent a genuine constraint, approval, handoff, or technical requirement.
Challenge: The timeline is not maintained
Solution: Make schedule review part of the project routine. A short weekly check is usually more effective than a major cleanup shortly before launch.
FAQs About ClickUp Gantt Charts
Can I create a Gantt chart in ClickUp?
Yes. You can add a Gantt view to a suitable ClickUp location, such as a space, folder, or list, depending on your workspace setup. After adding the view, assign task dates and connect dependencies. Availability can vary by plan and permissions, so check your current workspace settings if the option does not appear.
Is ClickUp’s Gantt chart free?
ClickUp’s availability and limits can depend on the plan you use. Some Gantt functionality may be available on lower tiers, while advanced capacity or usage limits may differ. Review ClickUp’s current plan details before committing to a workflow that depends heavily on the view.
Can ClickUp Gantt charts show dependencies?
Yes. Dependencies connect related tasks and help show which activities rely on others. For example, you can connect development completion to testing start. Use these relationships selectively, because linking every task can make the schedule difficult to interpret.
What is the difference between a ClickUp Gantt chart and a timeline?
Both views help you understand work over time, but teams often use them for different levels of scheduling detail. A Gantt chart typically emphasizes task duration, hierarchy, milestones, and dependencies. A timeline may provide a broader visual summary of activities and dates. The available behavior depends on ClickUp’s current view features and workspace configuration.
Can I use a Gantt chart for agile projects?
Yes, although it should complement sprint planning rather than replace it. Use the Gantt view for release timing, cross-team dependencies, and milestones. Use sprint or board views for daily execution, backlog decisions, and workflow status. This combination gives you both strategic timing and operational detail.
Is ClickUp a good choice for project scheduling?
It can be a practical choice when you want task management, scheduling, dependencies, and several planning views in one workspace. Evaluate it against your team’s needs for reporting, permissions, automation, workload planning, integrations, and plan limits. A short pilot with a real project will reveal more than a feature checklist alone.
Conclusion
ClickUp does include a Gantt chart, and you can use it to visualize task durations, milestones, dependencies, and project timing. The view is most useful when dates, ownership, and relationships stay accurate.
But here's the truth: a Gantt chart cannot repair unclear priorities or unrealistic estimates. It can reveal those problems earlier, giving you time to adjust the plan before they become launch delays.
Start with a focused project, add meaningful dependencies, review the schedule regularly, and choose other ClickUp views when your team needs status or capacity information. If you are also comparing a Jira alternative, evaluate ONES Project for workflow flexibility, native reporting, sprint management, automation, and self-hosted deployment options.