Are Gantt Charts Outdated? 7 Signs Your Team Needs More
Are Gantt charts outdated, or is your team using them for work they were never designed to manage? A timeline can show tasks, dates, and dependencies clearly. Yet it can become frustrating when priorities shift daily, several teams share the same work, or approvals keep changing the plan.
The warning signs are easy to miss. Your chart may look complete while people still ask what to do next, where a task stands, or who owns a blocked decision. Updating the timeline can also become a weekly ritual that adds effort without improving delivery.
But here's the good news: you do not need to abandon Gantt charts immediately. You need to recognize where they stop helping and add more responsive planning practices around them.
Are Gantt Charts Outdated? The Short Answer
Gantt charts are not outdated, but they are insufficient for many modern project teams. They remain useful for visualizing schedules, milestones, task durations, dependencies, and resource timing. They become less effective when work changes faster than the chart can be maintained.
Think of a Gantt chart as a map of planned movement. It can show the route clearly, yet it cannot always reflect traffic, unexpected detours, changing destinations, or conversations between drivers.
Here's why: project work increasingly involves parallel teams, iterative delivery, shifting priorities, approval loops, and ongoing operational tasks. A fixed timeline struggles when the plan evolves continuously.
What Gantt charts still do well
- Showing when major work should begin and end
- Displaying task dependencies and milestone dates
- Communicating a high-level delivery schedule
- Highlighting overlapping work across teams
- Supporting long-range planning and launch coordination
- Making schedule delays easier to spot
Where a timeline alone falls short
- It may not show why a task is blocked.
- It rarely captures the full conversation around a decision.
- It can become stale after a small scope change.
- It may hide workload imbalance between team members.
- It does not automatically create alignment across functions.
- It can encourage teams to focus on dates instead of outcomes.
The practical answer is simple: keep the chart when it clarifies timing, then add tools and habits for prioritization, collaboration, progress tracking, and knowledge sharing.
Seven Signs Your Team Needs More Than a Gantt Chart
1. Your plan becomes outdated within days
A Gantt chart works best when dates remain reasonably stable. If priorities change every few days, the chart can turn into a historical record rather than a useful planning tool.
For example, a product team may move three features into the next sprint after a customer escalation. Each move affects dependencies, testing, design reviews, and launch timing. If updating the chart takes an hour, people may stop maintaining it.
What to add: Use a prioritized backlog, short planning cycles, and clear change ownership. Keep the Gantt view for major milestones instead of every small task.
2. People ask for status outside the chart
Notice how often teammates ask questions such as, “Is this ready for review?” or “Why is this task blocked?” These questions reveal that the timeline does not contain enough operational context.
A task bar can show that testing lasts five days. It may not explain that testing is waiting for a build, a security decision, or a specific environment.
What to add: Track status, blockers, owners, comments, acceptance criteria, and review activity in the same workspace as the task.
3. Dependencies keep surprising the team
Gantt charts display planned relationships well. They can struggle when dependencies are informal, cross-functional, or discovered during execution.
Imagine marketing needs final product screenshots before preparing a campaign. The dependency may exist in a conversation rather than in the schedule. When the engineering handoff slips, marketing discovers the problem late.
What to add: Connect related work, assign dependency owners, and review blocked items during regular planning meetings.
4. Your team manages several work types at once
Many teams handle planned projects, urgent requests, maintenance, approvals, support issues, and recurring work. A single timeline can become crowded when every item competes for visual attention.
A software team may use the same planning space for a product release, bug fixes, infrastructure upgrades, and customer commitments. Each work type needs different prioritization rules.
What to add: Separate work by project, workflow, priority, or service type while keeping shared ownership and reporting visible.
5. The chart encourages date-first decisions
When a deadline dominates the screen, teams may rush tasks simply because a bar ends on Friday. That can hide questions about value, quality, risk, and customer impact.
For instance, a team may complete ten low-impact tasks before a launch while leaving one critical usability issue unresolved. The schedule looks healthy, yet the outcome remains weak.
What to add: Pair dates with outcome goals, priority levels, acceptance conditions, and risk reviews.
6. Workload imbalance is difficult to see
A Gantt chart can show when tasks happen without showing how difficult each task is. Five short assignments may require less effort than one complex investigation.
One specialist might own several parallel activities while another has only one large task. Their timeline bars may look similar, even though their actual capacity differs significantly.
What to add: Track estimates, capacity, ownership, active work, and overdue items through workload views or reports.
7. Project knowledge lives in scattered places
Project decisions often spread across chat messages, meeting notes, task comments, and personal workspaces. A timeline cannot preserve the reasoning behind every change.
Six weeks later, a new teammate may see that a milestone moved but not understand who approved the change or which requirement caused it.
What to add: Maintain a shared knowledge area for requirements, decisions, procedures, meeting outcomes, and project context.
Why Project Teams Outgrow Timeline-Only Planning
Project complexity increases when more people, systems, and decisions interact. A schedule shows time relationships, while delivery depends on communication, ownership, information, and feedback.
Consider a website relaunch. Design may finish on Tuesday, engineering may need two extra days, legal may request new language, and marketing may already have a campaign scheduled. The timeline captures dates, yet the team also needs decisions, conversations, review status, and clear escalation paths.
The issue is usually workflow visibility. A chart can show that a task is late. A connected project workspace can show the reason, the responsible person, the next action, and the effect on related work.
Planned work and actual work rarely match perfectly
Plans are useful because they create direction. Actual delivery reveals new constraints. A healthy planning system makes that difference visible without forcing you to rebuild the entire plan after every change.
For example, a two-week sprint may begin with twelve planned tasks. After a production issue appears, the team adds emergency work and removes two lower-priority items. A flexible workflow records the change while preserving the original commitment for later review.
Visibility needs several layers
Executives may need milestone progress. A project manager may need dependency and risk details. A specialist may need only today’s assigned work and review requests.
One view rarely serves every role. That is why modern project planning often combines timelines with boards, lists, dashboards, workload views, and shared knowledge spaces.
What to Use Alongside a Gantt View
Backlogs for changing priorities
A backlog gives your team a controlled place for upcoming work. It helps you rank requests before placing them on an active schedule.
Suppose a sales request arrives during a release cycle. The team can assess urgency, effort, customer impact, and dependencies before deciding whether to interrupt current work.
Boards for daily execution
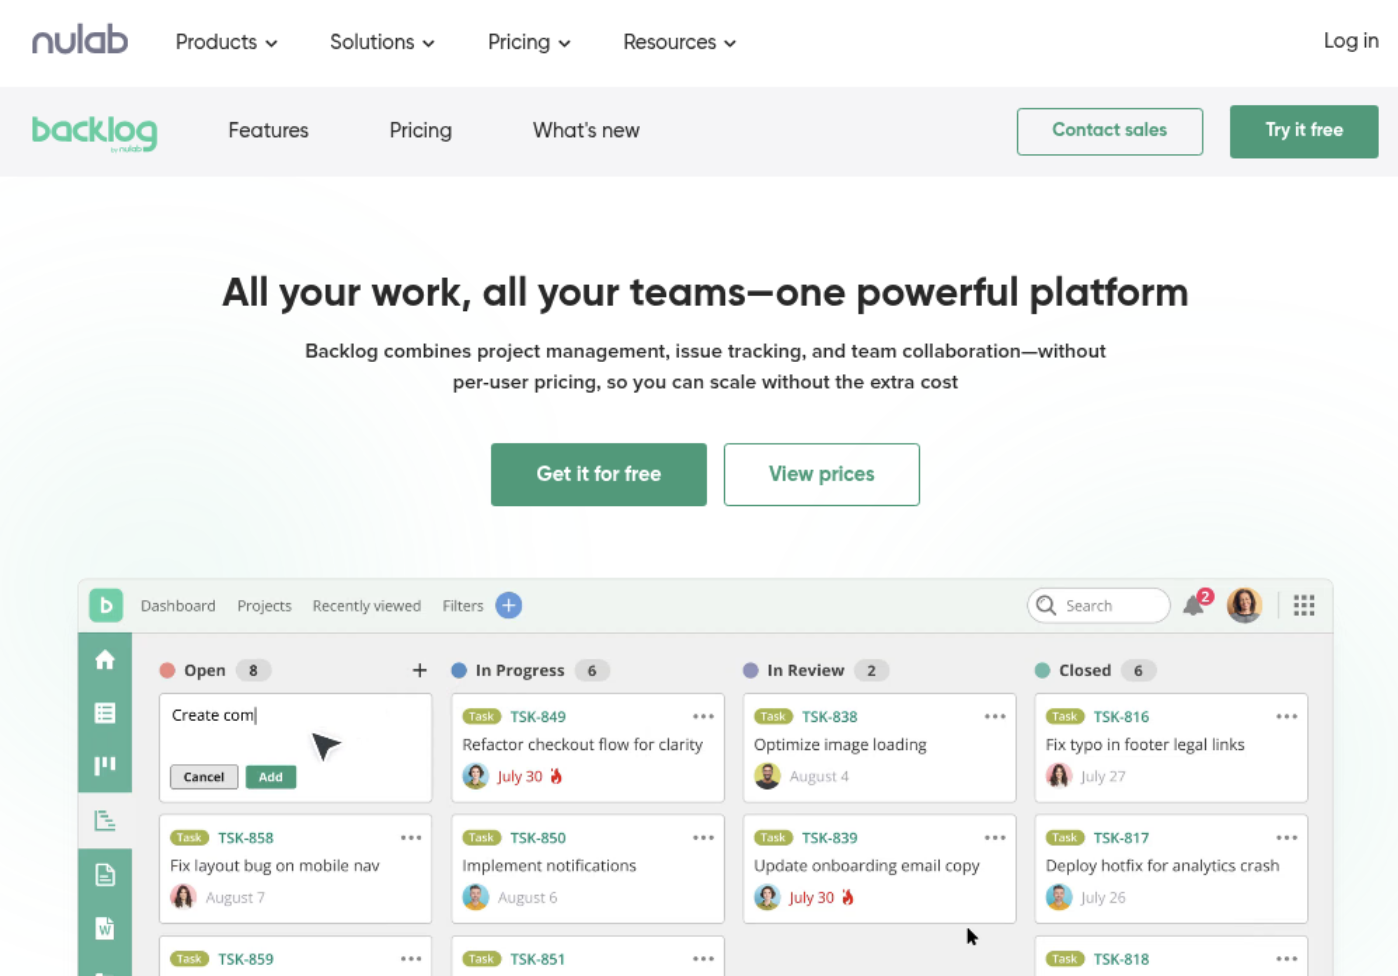
A board makes workflow stages visible. Columns such as Planned, In Progress, Review, Blocked, and Done help people understand movement without reading every timeline bar.
This view is especially useful for short-cycle work. Team members can see bottlenecks quickly and limit the amount of unfinished work moving through the process.
Dashboards for progress and risk
A dashboard can combine completion trends, overdue items, blocked work, sprint progress, and workload indicators. It turns scattered activity into a repeatable management view.
For example, a project lead might notice that overall completion is rising while blocked work has doubled. That contrast calls for action before the milestone slips.
Knowledge spaces for decisions and guidance
A shared knowledge area preserves requirements, decisions, operating procedures, release notes, and lessons learned. It reduces the need to repeat explanations in every meeting.
When a new contributor joins a project, they can understand the goal and working rules without asking several people for the same background.
Automation for routine coordination
Simple automation can assign review tasks, notify owners about approaching deadlines, update statuses, or flag overdue work. This reduces manual follow-up.
Automation should support judgment rather than replace it. A notification can highlight a risk, while the team still decides how to resolve it.
How to Decide Whether to Keep Your Gantt Chart
You do not need to choose between a timeline and flexible project management. Start by matching each planning view to the question it answers.
| Planning question | Useful view |
|---|---|
| When should major milestones happen? | Gantt chart or roadmap |
| What should the team work on next? | Prioritized backlog |
| Where is work currently stuck? | Board or blocked-work view |
| Who has too much active work? | Workload or capacity view |
| What is changing across the project? | Reports, activity history, and change tracking |
| Why was a decision made? | Shared knowledge space |
The best choice depends on your work pattern. A construction project with fixed phases may rely heavily on timeline planning. A software team handling frequent releases may need boards, backlogs, automation, and sprint reporting every day.
Here's a practical test: ask five teammates what they need to know before starting work. If the answer includes priority, context, blockers, review status, or ownership, your chart needs support.
A simple evaluation exercise
- List the questions your team asks during a typical week.
- Mark which questions the current timeline answers clearly.
- Group the unanswered questions into priority, execution, workload, communication, and knowledge.
- Choose one additional view or workflow for the largest gap.
- Review the result after two delivery cycles.
This exercise avoids replacing a familiar practice without understanding its value. It also shows whether your main problem is the chart itself or the surrounding workflow.
A Practical Project Planning Solution: ONES.com
ONES.com combines project management and knowledge management in one platform. ONES Project supports project planning and delivery, while ONES Wiki provides a shared knowledge base. They are sold separately and can support teams that need more than a timeline.

The platform can suit teams seeking a Jira alternative with Jira-compatible workflows, built-in reporting, custom workflows, custom fields, sprint management, automation, and self-hosted deployment options.
Core capabilities
1. Scattered work — connected project spaces
When tasks, ownership, and status sit in separate places, follow-up becomes slow. ONES Project brings project work into structured spaces with clear assignments and progress details.
The result is a more direct path from planned work to active execution.
2. Rigid processes — custom workflows
Different teams move work through different stages. ONES Project supports custom workflows so you can reflect review, approval, testing, release, or service processes.
Your team can adapt the workflow to its operating model instead of forcing every project into the same sequence.
3. Unclear ownership — assigned responsibilities
When several people contribute to one milestone, responsibility can become vague. Assignments, task relationships, and workflow states make ownership easier to inspect.
That clarity helps you identify the next action before a delay grows.
4. Limited timeline context — linked project details
A timeline can show duration and dependency. ONES Project adds task details, status information, comments, custom fields, and related work around the schedule.
You can retain a Gantt-style view while giving the team more context for daily decisions.
5. Manual progress updates — built-in reporting
Preparing status reports manually takes time and can produce inconsistent results. ONES Project includes reporting capabilities for tracking progress, delivery activity, and project health.
Leaders gain a clearer view without asking every contributor to create a separate update.
6. Repetitive coordination — automation
Routine actions such as assigning follow-up work or updating a status can consume attention. Automation helps handle predictable transitions and notifications.
Your team can spend more time resolving exceptions and less time repeating administrative steps.
7. Fragmented project knowledge — ONES Wiki
Requirements, decisions, guides, and project context need a shared home. ONES Wiki provides a knowledge management space that complements ONES Project.
Teams can connect planning activity with the information people need to understand and complete the work.
8. Deployment restrictions — flexible hosting options
Some organizations cannot place project information in a public cloud environment. ONES.com supports Cloud, On-Premise, Private Cloud, and Air-gapped deployments.
The self-hosted version maintains full feature parity with the cloud version, giving restricted environments a broader planning option.
9. Plugin dependence — native capabilities
When essential functions require many add-ons, administration and maintenance can become difficult. ONES Project includes sprint management, reporting, custom workflows, custom fields, and automation natively.
That can reduce reliance on plugins while keeping familiar Jira-compatible workflows.
Application scenarios
Software release coordination
A software team can use a timeline for release milestones, a board for daily engineering work, sprint management for short-cycle planning, and ONES Wiki for requirements and decisions.
When testing slips, the team can connect the blocked work to the release milestone and review the effect through project reporting.
Cross-functional campaign delivery
Marketing, design, legal, and product teams can manage a campaign through custom workflow stages. Each group sees assigned work while project leads monitor shared milestones.
Approval details and campaign guidance can remain available through the knowledge space instead of disappearing into scattered conversations.
Restricted-network project management
An organization with strict hosting requirements can choose an on-premise, private cloud, or air-gapped deployment. The team can still use project workflows, reporting, sprint planning, and automation.
This gives the organization a way to improve coordination without moving project operations into an unsuitable environment.
Common Challenges When Moving Beyond Gantt Charts
Challenge 1: The team feels overwhelmed by multiple views
Adding boards, reports, backlogs, and knowledge spaces can create confusion if every view becomes mandatory.
Solution: Assign each view one purpose. Use the timeline for milestones, the board for execution, the backlog for prioritization, and reports for review.
Challenge 2: People stop maintaining the plan
A planning system loses value when statuses remain unchanged or tasks lack owners. This often happens when updating the system feels separate from normal work.
Solution: Keep updates lightweight. Define a small set of workflow states and make status review part of planning meetings.
Challenge 3: Teams disagree about priority
A timeline cannot resolve competing requests by itself. Different stakeholders may each consider their work urgent.
Solution: Use visible priority rules. Compare customer impact, risk, effort, deadline sensitivity, and strategic value before moving work into active delivery.
Challenge 4: Historical plans become confusing
Constant edits can make it difficult to understand what the team originally expected and why the plan changed.
Solution: Record major scope and milestone changes with a short explanation. Preserve meaningful checkpoints while keeping the active plan current.
Challenge 5: The organization expects one tool to solve every problem
Technology cannot replace clear ownership, realistic capacity planning, or timely decisions. A better platform still needs sensible operating habits.
Solution: Improve the workflow first, then configure the platform around it. Start with one project and measure fewer status questions, faster decisions, or clearer ownership.
FAQs About Gantt Charts and Modern Project Planning
Are Gantt charts still useful for Agile teams?
Yes. Agile teams can use Gantt charts for release milestones, cross-team dependencies, launch dates, and long-range planning. They are less suitable for representing every sprint task when priorities change frequently. A backlog and board usually support daily execution better, while the timeline communicates broader timing to stakeholders.
What is the biggest weakness of a Gantt chart?
The biggest weakness is limited context. A chart can show when work should happen, yet it may not explain blockers, decisions, ownership, workload, or changing priorities. Teams often need connected workflows, conversations, reports, and knowledge areas alongside the timeline to manage those details effectively.
Should I replace my Gantt chart with a Kanban board?
That depends on the work. A Kanban board helps teams manage continuous flow, changing priorities, and bottlenecks. A Gantt chart helps communicate deadlines, dependencies, and milestone timing. Many teams benefit from using both: the board for execution and the timeline for coordination.
When is a Gantt chart the right choice?
A Gantt chart works well when activities have meaningful durations, dependencies, and relatively stable milestones. Examples include construction planning, event coordination, product launches, compliance programs, and large implementation projects. It becomes less effective when most work is unpredictable or changes several times each week.
How can I make a Gantt chart more useful?
Limit it to meaningful tasks and milestones, assign clear owners, connect dependencies, and review it at a regular cadence. Pair it with a prioritized backlog, execution board, risk view, and shared knowledge space. Keep the timeline focused on coordination rather than forcing it to manage every operational detail.
Is ONES Project a Jira alternative for teams that still need timeline planning?
ONES Project supports Jira-compatible workflows while also providing sprint management, custom workflows, custom fields, automation, reporting, and project coordination capabilities. Teams can use a timeline for milestone planning and additional views for daily work. ONES.com also offers Cloud, On-Premise, Private Cloud, and Air-gapped deployment options.
Conclusion
Gantt charts are not outdated. They remain valuable for showing milestones, dependencies, and expected timing. The warning sign appears when your team needs the chart to manage changing priorities, blockers, workload, decisions, and shared knowledge.
But here's the truth: a timeline is only one layer of project coordination. Add a backlog for priority, a board for execution, reports for visibility, automation for routine actions, and a knowledge space for context.
If your team spends more time updating the plan than using it, examine the seven signs above. A broader project management workflow can preserve the clarity of Gantt planning while giving your team the flexibility modern delivery requires.