Are Gantt Charts Agile? A Practical Guide for Agile Teams
Agile teams often hear that Gantt charts belong to traditional project management. That can create a frustrating choice: abandon a useful planning view or risk slowing down sprints with rigid schedules. The confusion grows when a team needs to show dependencies, release timing, or cross-team commitments while still welcoming change.
But here's the truth: Gantt charts can support Agile when you use them as flexible planning maps rather than fixed promises. They help you see how work connects, when a release may happen, and where a delay could spread. The key is keeping plans at the right level, updating them regularly, and letting completed work guide future forecasts.
This guide explains when Gantt charts fit Agile, how to use them without creating waterfall habits, and which planning practices make the combination practical.
Are Gantt Charts Agile? The Short Answer
Gantt charts are not inherently Agile or non-Agile. They are visual planning tools. Their value depends on how you use them, how often you update them, and whether they support adaptation.
An Agile team can use a Gantt chart to show epics, releases, dependencies, milestones, and broad delivery forecasts. The chart becomes a problem when it treats every task, date, and estimate as permanent before the team learns enough to plan confidently.
Here's why: Agile planning happens at several levels. You may plan a sprint in detail, a release in moderate detail, and a product roadmap in broad themes. A Gantt chart can support all three levels when its detail matches the amount of certainty available.
What makes a Gantt chart compatible with Agile?
- It shows broad time ranges rather than pretending every date is exact.
- It focuses on outcomes, epics, releases, and major dependencies.
- It uses rolling-wave planning, with near-term work more detailed than future work.
- It changes when priorities, capacity, risks, or customer needs change.
- It complements the product backlog instead of replacing it.
- It helps conversations without becoming a compliance scorecard.
When does a Gantt chart become un-Agile?
A Gantt chart starts working against Agile values when it locks the team into a long sequence of detailed tasks. For example, a manager may create a six-month plan with exact dates for every ticket, then judge the team whenever discovery changes the plan.
That approach discourages learning. Team members may rush incomplete work, hide emerging risks, or avoid valuable changes because the chart looks more important than the product outcome.
A simple comparison
| Agile-friendly use | Rigid use |
|---|---|
| Shows release windows and major dependencies | Locks every task to an exact future date |
| Updates after meaningful planning events | Remains unchanged while reality moves on |
| Supports forecasting and discussion | Measures people against guesses |
| Links to backlog items and outcomes | Replaces prioritization and customer feedback |
| Uses uncertainty visibly | Hides uncertainty behind precise dates |
How Agile Teams Can Use Gantt Charts Effectively
The most practical approach is to use a Gantt chart for coordination and forecasting, while the product backlog remains the place for priority and detailed execution.
1. Choose the planning horizon first
Decide what the chart needs to communicate. A sprint-level chart may help coordinate a complex implementation. A release-level chart may help several teams plan integration. A portfolio-level chart may show major initiatives across a quarter.
Do not begin by adding every task you can find. Start with the question the chart must answer. For example, “Can three teams complete the mobile launch this quarter?” requires a different view than “Which work remains in this sprint?”
2. Put outcomes and epics on the main timeline
Use meaningful planning units such as “checkout redesign,” “payment integration,” or “security validation.” These units give stakeholders a clear view without forcing developers into an artificial task sequence months ahead.
You can keep detailed stories in the backlog and display only their parent epic on the timeline. This reduces visual noise while preserving a connection between strategic work and daily delivery.
3. Add milestones that represent real decisions
Useful milestones include a pilot release, regulatory review, usability test, integration checkpoint, or production launch. Each milestone should mark something that changes what the team can do next.
A milestone such as “development complete” may be less useful if testing, approval, and rollout still carry significant risk. Agile planning improves when milestones reflect customer or delivery value.
4. Show dependencies without creating a rigid chain
Dependencies explain why one piece of work may wait for another. For example, an analytics dashboard may depend on an event-tracking update, while a mobile release may depend on an external payment service.
Show only dependencies that affect coordination. If you connect every small task, the chart becomes difficult to maintain and gives the impression that work must follow one exact path.
5. Plan near-term work in detail
Use detailed estimates for the next sprint or two, where the team has better information. Use broader ranges for work several months away.
For example, you might show “API migration” across two planned sprints while representing “performance optimization” as a later release theme. As the team learns more, the later theme can become more specific.
6. Connect the chart to actual progress
Update the timeline using completed work, remaining scope, team capacity, and new risks. A finished sprint should give you better forecasting information than an early opinion.
If a team usually completes between 25 and 35 backlog points per sprint, that range can inform a release forecast. The exact number matters less than using observed delivery patterns instead of wishful precision.
7. Review the plan at a regular cadence
Review the chart during release planning, portfolio reviews, or cross-team coordination meetings. Avoid forcing a daily Gantt update when the backlog already provides a better operational view.
The review should ask practical questions: What changed? Which dependency moved? What decision is blocked? Does the release forecast still make sense?
8. Make uncertainty visible
Use ranges, confidence labels, or separate visual markers for confirmed and tentative milestones. A release planned for “the week of September 15” communicates uncertainty more honestly than a false promise of September 17.
You can also mark assumptions, such as “payment provider approval expected” or “design capacity available in Sprint 8.” When an assumption changes, the impact becomes easier to discuss.
Where Gantt Charts Fit in the Agile Planning System
Agile planning works across several horizons. Each horizon answers a different question, so one planning view rarely serves every purpose.
Backlog: What should the team do next?
The product backlog holds prioritized work, acceptance details, and refinement decisions. It is the best place for deciding what enters an upcoming sprint.
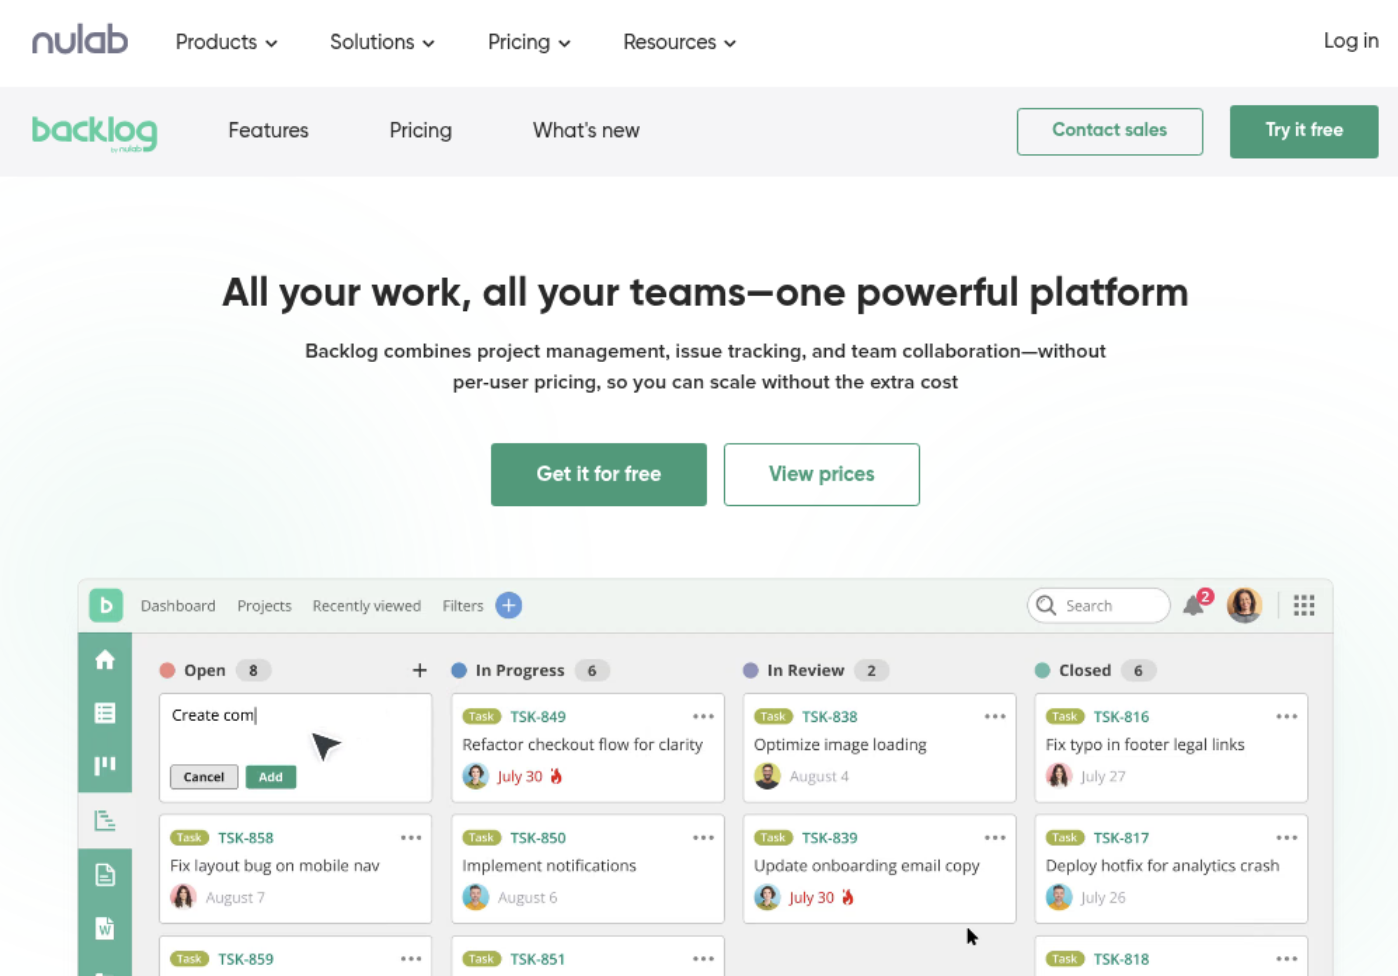
Sprint board: What is happening now?
A sprint board shows active work, blocked items, review status, and completion. It gives the team a near-real-time picture of execution.
Gantt chart: How does work connect over time?
A Gantt chart adds a timeline view. It can show when several epics overlap, where integration points occur, and whether a release window has enough room for validation.
Roadmap: Why does this work matter?
A roadmap communicates product direction, customer outcomes, and strategic themes. It usually avoids the task-level detail that makes a Gantt chart useful.
Think of these views as different lenses. A sprint board is like a close-up camera. A roadmap is a wide landscape view. A Gantt chart sits between them, showing sequence, overlap, and timing.
Benefits of Using a Timeline View with Agile
A timeline can improve coordination when several groups contribute to one outcome. Consider a product launch involving engineering, design, legal review, customer support, and marketing. A backlog may show the work, but a timeline makes cross-functional timing easier to discuss.
Better dependency awareness
Teams often discover dependencies late because each group sees only its own queue. A timeline can reveal that testing begins before an integration environment is ready or that training materials depend on a feature that has not reached review.
Clearer release conversations
Stakeholders frequently ask when a capability will be available. A Gantt view lets you discuss the conditions behind a forecast, including capacity, approval points, and technical uncertainty.
Improved coordination across teams
Suppose Team A owns identity services and Team B owns account recovery. If both teams plan separately, a shared timeline can highlight the integration window and reduce surprise work.
More realistic risk discussions
A dependency that slips by three days may have little effect if the plan contains slack. The same delay may threaten a launch if validation has no room. A timeline helps you see that difference.
The best part? A Gantt chart can support transparency without requiring every estimate to be perfect. It gives you a place to discuss uncertainty openly.
Common Mistakes Agile Teams Make with Gantt Charts
Most problems come from treating a planning aid as a contract. The chart itself is rarely the issue. The surrounding behavior determines whether it helps or harms the team.
Planning every task too far ahead
A detailed task list six months into the future will probably change. New technical findings, customer feedback, and staffing shifts can make the original sequence irrelevant.
Keep distant work at the epic or outcome level. Detail it when the team has enough information to make the detail useful.
Confusing estimates with commitments
An estimate describes a likely effort or time range. A commitment represents a deliberate promise with known trade-offs. Mixing the two creates unnecessary pressure.
Label forecasts clearly. You might use “target,” “expected,” and “committed” as separate categories, provided the team agrees on their meaning.
Tracking activity instead of value
A chart full of completed tasks can look healthy while the customer still lacks a usable outcome. For example, ten technical tasks may be complete, yet the payment flow remains unavailable because one integration issue is unresolved.
Group work around outcomes and review whether each milestone produces something useful or reduces meaningful risk.
Ignoring unfinished work
Teams sometimes move a task to complete because its coding portion ended. Agile delivery usually requires testing, review, integration, and release readiness.
Define completion consistently. If the chart says an epic is finished, everyone should understand whether that includes validation and production deployment.
Using the chart as a performance weapon
When leaders compare people against early guesses, the plan becomes less trustworthy. Team members may pad estimates or avoid updating the timeline.
Use the chart to improve decisions. Ask what the plan is teaching you, rather than who should be blamed for a changed forecast.
Gantt Charts Compared with Other Agile Planning Views
You do not need to choose one planning method for every situation. The strongest approach uses each view for the decision it supports best.
| Planning view | Best question | Useful strength |
|---|---|---|
| Product backlog | What should we prioritize? | Detailed ordering and refinement |
| Sprint board | What is happening now? | Execution flow and blockers |
| Kanban board | Where is work accumulating? | Flow visibility and work-in-progress control |
| Roadmap | Which outcomes matter next? | Product direction and strategic communication |
| Gantt chart | How do activities connect over time? | Timing, overlap, milestones, and dependencies |
For example, a Kanban board may show that testing is overloaded. A Gantt chart may show that the overload threatens a regulatory milestone. Together, the views support both operational action and broader coordination.
A Practical Operating Model for Agile Timeline Planning
Start with a lightweight chart for one release or initiative. Include major outcomes, a few milestones, known dependencies, and broad time ranges. Keep the first version small enough to review in one meeting.
During each planning cycle, compare the forecast with completed work. Move uncertain items, adjust dependencies, and record decisions that affect timing. The goal is a living plan that reflects current knowledge.
A sample planning rhythm
- Every sprint: update completed work, remaining scope, and immediate dependencies.
- Every release planning session: review milestones, capacity, risks, and forecast ranges.
- Every stakeholder review: explain changes and decisions using the timeline.
- After a major change: revise affected dates instead of preserving an outdated baseline.
- After delivery: compare the forecast with reality and improve future planning.
Let me explain: Agile does not require you to avoid planning. It requires you to plan in a way that respects uncertainty and welcomes learning.
A concrete example
Imagine a team preparing a subscription upgrade flow. The release includes pricing rules, interface changes, billing integration, accessibility testing, and customer support training.
The chart can show the upgrade flow as the main epic, with billing integration and accessibility testing as dependencies. It can mark support training as a milestone before launch. The product backlog still controls story priority and sprint selection.
If billing integration takes longer than expected, the team can move the forecast, explore a smaller release, or change the launch scope. The chart supports the conversation rather than dictating an outdated answer.
Agile Timeline Planning Solution: ONES.com
ONES.com brings project management and knowledge management together on one platform, with AI support through ONES Assistant. ONES Project is the project management product and a Jira alternative, while ONES Wiki supports knowledge management as a Confluence alternative. They are sold separately.

For Agile teams using timeline planning, the practical value is keeping planning, execution, reporting, and team knowledge connected. You can choose Cloud, On-Premise, Private Cloud, or Air-gapped deployment. The free plan supports up to 30 seats, and the self-hosted version has full feature parity with the cloud version.
Core capabilities
- Scattered planning views → unified project management: ONES Project brings backlog planning, sprint management, timeline visibility, and reporting into one environment. Teams spend less time reconciling separate planning systems.
- Rigid scheduling habits → custom workflows: Custom workflows let you represent review, testing, approval, and release stages that match your delivery process. The result is a timeline that reflects actual work rather than generic steps.
- Unclear work ownership → custom fields: Custom fields can capture release, team, risk, confidence, or dependency details. That context helps you interpret a milestone without adding long explanations.
- Hidden cross-team dependencies → connected planning: Jira-compatible workflows and linked work items help teams connect related activity. The result is better visibility when one team’s delay affects another team’s forecast.
- Manual progress checks → built-in reporting: Built-in reporting helps you review sprint progress, scope movement, and delivery trends. Teams can use those signals to improve forecasts instead of relying on early guesses.
- Repetitive coordination → automation: Automation can trigger routine actions as work changes state. For example, a review transition may notify the appropriate group or create a follow-up action.
- Plugin-heavy setups → native feature coverage: Native planning, reporting, workflow, field, and sprint capabilities can reduce dependence on multiple plugins. That can simplify administration and keep the working experience more consistent.
- Restricted hosting requirements → flexible deployment: On-Premise, Private Cloud, and Air-gapped options support teams with stricter infrastructure requirements. This is useful when an Agile process must operate inside a controlled network.
Application scenarios
Scenario one: a regulated product release. A team can use ONES Project for backlog refinement and sprint delivery, then use timeline planning to coordinate security review, validation, and launch approval. Milestones make external dependencies visible without turning every story into a long-term commitment.
Scenario two: a multi-team platform migration. Platform, application, and support teams can connect their work through shared workflows and dependencies. A release view highlights integration points, while each team keeps detailed execution inside its own sprint process.
Scenario three: a restricted-network engineering group. An air-gapped deployment can provide the same core product capabilities as the cloud version. The team can maintain Agile planning and reporting within its required environment.
Common Challenges with Agile Gantt Planning
Challenge: Stakeholders demand exact dates
Solution: Present a forecast range and explain the conditions behind it. Show which milestones are firm, which are targets, and which depend on unresolved decisions.
Challenge: The chart becomes too crowded
Solution: Keep the main view at the epic and milestone level. Let people open related work when they need task detail, rather than displaying every item at once.
Challenge: The timeline and backlog disagree
Solution: Establish one ownership rule. The backlog should control priority and sprint selection, while the timeline should summarize timing and coordination. Review mismatches during planning.
Challenge: Dependencies create constant delays
Solution: Identify the highest-risk dependency early and assign an owner. Consider parallel discovery, a temporary workaround, or a smaller release that reduces the dependency.
Challenge: People stop updating the plan
Solution: Make updates part of an existing planning event. If maintaining the chart requires a separate meeting every day, simplify the chart and reduce its detail.
FAQs About Agile Teams and Gantt Charts
Can Agile teams use Gantt charts?
Yes. Agile teams can use Gantt charts for release forecasting, dependency management, milestone coordination, and cross-team communication. The chart should remain flexible and reflect current knowledge. Keep detailed execution in the backlog or sprint board, then use the timeline to show how larger pieces connect over time.
Are Gantt charts suitable for Scrum?
They can be suitable for Scrum when they support release-level or multi-team planning. Scrum teams still need a product backlog, sprint planning, daily collaboration, review, and retrospective. A Gantt chart should complement those activities rather than replace them or prescribe every sprint task months ahead.
How often should an Agile Gantt chart be updated?
Update it whenever a meaningful change affects timing, scope, capacity, or dependencies. Many teams review it during sprint or release planning instead of updating it daily. A useful rhythm is a detailed review every sprint and a broader milestone review at each release checkpoint.
Should every Agile task appear on the timeline?
Usually, no. Adding every task can create maintenance work and false precision. Show epics, outcomes, milestones, and dependencies on the main view. Keep individual stories and implementation tasks in the backlog unless a particular task has coordination or deadline importance.
What should an Agile Gantt chart measure?
It should help you understand progress toward outcomes, milestone movement, dependency risk, scope change, and release confidence. Avoid using it as a simple count of completed tasks. A team may finish many tasks while still lacking a tested, usable capability.
What is the best alternative when a Gantt chart feels too rigid?
Try a roadmap, Kanban board, release plan, or dependency map. The right choice depends on the question you need to answer. If you need flow visibility, use a Kanban board. If you need strategic direction, use a roadmap. If you need timing and cross-team coordination, keep a lightweight timeline.
Conclusion
So, are Gantt charts Agile? They can be. The deciding factor is the behavior around the chart: flexible forecasts, rolling planning, visible uncertainty, and continuous adjustment.
Use the backlog to prioritize work, the sprint board to manage current execution, and the Gantt view to explain timing, dependencies, and milestones. Keep near-term plans detailed and future plans broad. Update the timeline when reality teaches you something new.
That approach solves the original problem without creating a new one. You gain a clear view of delivery coordination while preserving the inspection, adaptation, and customer focus that make Agile effective.