A Tracking Gantt Chart: 7 Steps for Clearer Project Work
Projects rarely fail because nobody made a plan. They fail because the plan stops reflecting reality. A task takes three days longer, a dependency quietly slips, and the team keeps reviewing an outdated schedule.
That gap creates confusion. Stakeholders ask for updates, project managers rebuild timelines, and team members spend more time explaining progress than moving work forward. A standard Gantt chart shows what should happen, but it may not clearly show what has actually happened.
Here’s the practical solution: use a tracking Gantt chart to compare planned work with real progress. You can see completed tasks, late activities, current milestones, and schedule risks in one view. The seven steps below will help you build one that supports useful decisions rather than merely decorating a status meeting.
How to Create and Use a Tracking Gantt Chart in 7 Steps
A tracking Gantt chart is a project timeline that compares planned dates and progress with actual performance. It shows task durations, dependencies, milestones, completion percentages, and schedule changes in one visual view.
The goal is simple: identify where the project stands now and what needs attention next. You can create this view in project management software or adapt an existing Gantt schedule with progress indicators and actual dates.
-
Define the project outcome and boundaries
Start by writing down the result the project must deliver. Then clarify what the team will handle, what it will not handle, and how success will be measured.
For example, a website redesign may include research, interface design, development, testing, and launch. It may exclude ongoing content production after launch.
This boundary matters because uncontrolled additions make schedule tracking unreliable. If a new request appears, you can decide whether it belongs in the current plan or requires a formal change.
-
Break the work into trackable tasks
Turn the project outcome into tasks that one person or one small team can understand and update. Avoid vague activities such as “finish marketing” or “build product.”
A clearer sequence might include “approve campaign audience,” “write landing page copy,” “review legal wording,” and “publish campaign.” Each activity has a more visible completion point.
Choose a useful level of detail. If a task lasts six weeks, progress may remain unclear for too long. If every task lasts one hour, the schedule becomes difficult to maintain.
-
Estimate durations and assign ownership
Give each task a planned start date, planned finish date, and responsible owner. Estimates should reflect available capacity, review time, technical uncertainty, and likely interruptions.
Suppose a design review usually takes two business days. Adding only a few hours for review creates a schedule that looks efficient but fails in practice.
Ownership also improves accuracy. A named person can update progress, flag a blocker, and explain a date change without creating an investigation for the project manager.
-
Connect dependencies and milestones
Dependencies show which activities rely on earlier work. A development task may depend on approved designs, while a launch may depend on completed testing and stakeholder sign-off.
Link tasks in the order they need to happen. Then add milestones for meaningful events, such as prototype approval, pilot completion, or public release.
Here’s why: a task can be on schedule while the overall project is still at risk. A missed dependency often creates that hidden risk before an individual task appears late.
-
Record the approved baseline
A baseline captures the agreed schedule before execution changes it. It gives you a reference point for comparing planned dates with actual dates.
For example, the baseline may show testing scheduled for June 10 through June 14. If testing actually starts on June 17, the difference becomes visible instead of disappearing inside a revised schedule.
Keep the baseline tied to an approved plan. Changing it every time work slips removes the comparison you need to understand performance.
-
Update progress with actual evidence
Update task status on a consistent rhythm. Record completed work, remaining effort, actual start dates, actual finish dates, blockers, and revised forecasts.
Use percentages carefully. A task marked 90% complete for two weeks may be less useful than a clear note saying, “Testing found three defects; final approval is now expected Friday.”
A practical status routine can include a short daily update for active work and a deeper weekly review for the entire schedule.
-
Review variance and take action
Compare the baseline with the current schedule. Look for delayed starts, extended durations, unfinished predecessors, overloaded owners, and milestones that are moving toward risk.
Then decide what to do. You might reassign work, remove a dependency, reduce scope, add review capacity, or communicate a revised delivery date.
The chart becomes valuable when it changes decisions. A late task that receives no action is only a visible problem, not a managed one.
What the Timeline Should Show
A useful tracking view combines planned information with current performance. At minimum, include task names, owners, planned dates, actual dates, dependencies, milestones, and completion status.
You can also add a baseline bar, a progress bar, a critical path indicator, and a field for risk or blocker notes. These additions help you move from “What is happening?” to “Why is it happening?”
Consider a product launch with 40 tasks. If the chart shows only green and red status labels, you may know that something is wrong but not whether the issue concerns design approval, engineering capacity, or testing.
The best part? A well-designed view reduces the need for separate status explanations. The schedule provides context before the meeting begins.
How to Read Planned Versus Actual Progress
Begin with the baseline. Ask whether each activity started and finished near its original dates. Then review the current forecast, because a task can be late already or likely to become late soon.
For example, a task planned for five days may be 60% complete after four days. That could be healthy if the remaining work is simple. It could also signal trouble if the unfinished portion includes testing or approval.
Look at trends across several updates. One delayed task may be an exception. Several tasks slipping in the same phase often indicate a capacity, dependency, or estimation problem.
| Signal | What it may indicate |
|---|---|
| Actual start is later than planned | A predecessor, approval, or resource was unavailable |
| Progress remains low near the planned finish | The estimate may have been too optimistic or the scope expanded |
| Many tasks finish on time but milestones slip | Dependencies or approval queues are delaying the larger outcome |
| Several owners have overlapping urgent tasks | Capacity conflicts may be affecting delivery |
Tracking Methods That Keep Updates Reliable
Choose a reporting rhythm that matches the work. A software team may update active tasks every day, while a construction or event team may review progress at key site or planning checkpoints.
Use consistent status meanings. For example, define “in progress” as work that has started, “blocked” as work unable to continue, and “complete” as work accepted by the responsible reviewer.
Set an update owner for each workstream. Without ownership, everyone assumes someone else will maintain the schedule. That is how a timeline becomes outdated while still appearing official.
You might be wondering: should every change trigger a schedule review? Usually, no. Focus on changes that affect dependencies, milestones, critical work, capacity, cost, or agreed scope.
Common Mistakes That Reduce Scheduling Clarity
One frequent mistake is treating completion percentages as precise measurements. A task marked 50% complete may have consumed 80% of its effort if the remaining work contains complex testing.
Another problem is hiding uncertainty inside fixed dates. When a task has unresolved technical questions, show the risk or add a discovery activity before promising a detailed delivery date.
Some teams also create a schedule with too many layers. A project lead may need a summary view, while a delivery team needs detailed activities. Both views can come from the same plan without showing every task to every audience.
Finally, avoid updating dates without preserving the original commitment. You need both perspectives: what the team expected and what the team now forecasts.
Natural Tracking Gantt Chart Solution: ONES.com
ONES.com brings project management and knowledge management into one platform. It can help you plan work, connect dependencies, follow progress, and keep project context accessible for the people making decisions.

ONES Project is the project management product and a Jira alternative. ONES Wiki provides knowledge management capabilities and works as a Confluence alternative. They are sold separately, so you can choose the product that fits your workflow.
When schedules become difficult to maintain, use connected project planning
Pain: Teams often keep task planning, progress updates, and planning discussions in disconnected places.
ONES capability: ONES Project connects task management, timeline planning, sprint management, dependencies, and reporting in one workspace.
Result: You can review the current schedule with more context and spend less time reconciling separate planning systems.
When Jira workflows need broader timeline visibility, use a Jira alternative with familiar structures
Pain: A team may understand Jira-compatible workflows but still need clearer planning views for milestones and longer projects.
ONES capability: ONES Project supports Jira-compatible workflows while adding Gantt-style planning, custom workflows, custom fields, and built-in reporting.
Result: You can preserve familiar ways of working while giving stakeholders a more readable view of delivery progress.
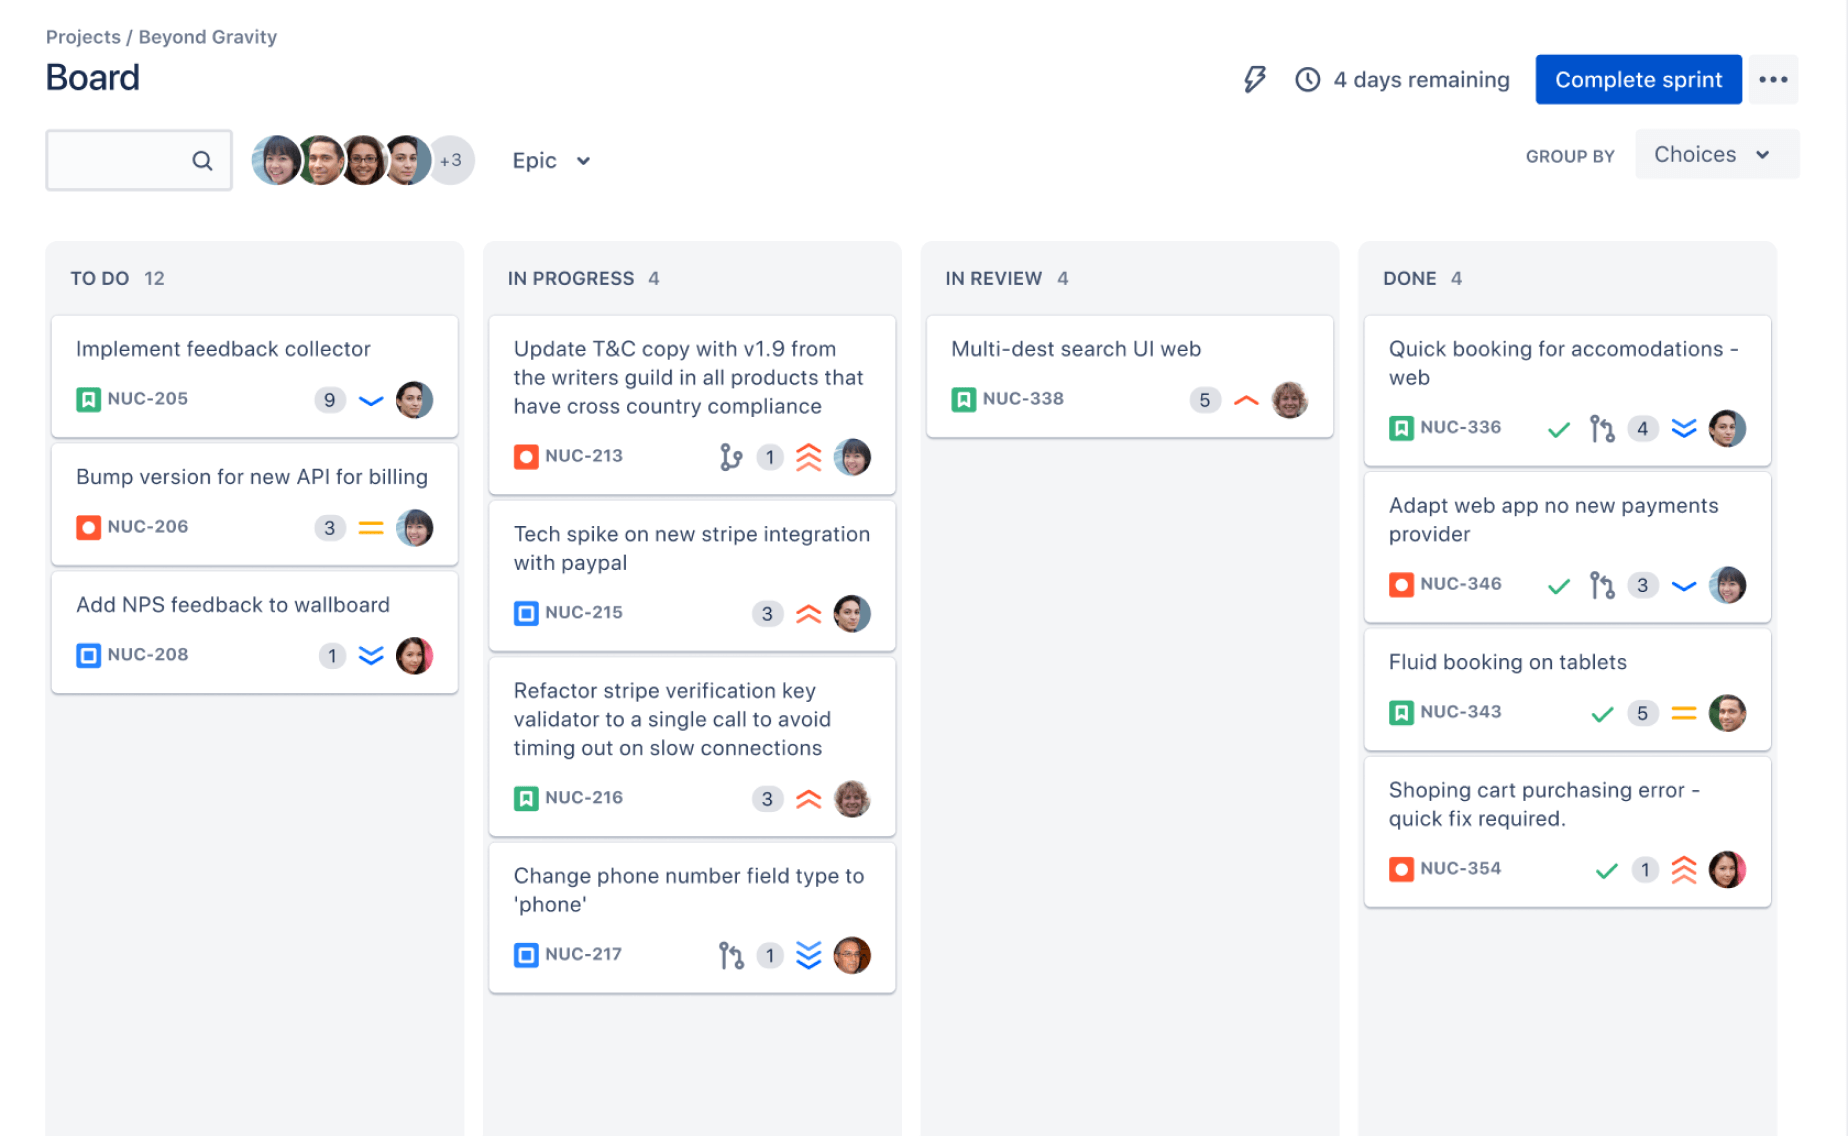
When progress reporting takes too much manual effort, use built-in reporting
Pain: Project managers may spend hours collecting updates before they can explain schedule variance.
ONES capability: Built-in reporting helps you review task status, progress, workload, and project trends within the same project environment.
Result: Status meetings can focus on decisions, risks, and recovery actions instead of basic information collection.
When every team needs a different approval path, use custom workflows
Pain: Product development, marketing, and operations rarely move through identical stages.
ONES capability: Custom workflows and custom fields let you reflect stages such as design review, compliance approval, pilot testing, and release readiness.
Result: Your progress view can match the real work rather than forcing every project into one generic process.
When repeated work creates avoidable delays, use automation
Pain: Assigning reviewers, changing statuses, and notifying owners manually can create small delays across many tasks.
ONES capability: Automation can support repeatable actions inside project workflows, such as triggering updates when a task changes stage.
Result: The team can spend more attention on exceptions and decisions that require judgment.
When teams need controlled deployment options, use flexible hosting
Pain: Some organizations cannot place project information in a standard public cloud environment.
ONES capability: ONES.com offers Cloud, On-Premise, Private Cloud, and Air-gapped deployments. The self-hosted version has full feature parity with the cloud version.
Result: You can choose an operating model that fits security, compliance, and network requirements without giving up core project capabilities.
When plugin sprawl creates maintenance work, use native capabilities
Pain: Multiple add-ons can create inconsistent fields, separate permissions, and extra maintenance for administrators.
ONES capability: ONES Project includes reporting, workflow customization, sprint management, automation, and timeline planning as native project capabilities.
Result: A team can reduce dependence on a patchwork of plugins and keep more of its workflow in one environment.
When a team needs to start without a large commitment, use the free allowance
Pain: A small team may want to test a new planning approach before making a broader purchasing decision.
ONES capability: ONES.com offers a free plan for up to 30 seats.
Result: You can trial project planning with a meaningful team size and evaluate whether the workflow supports real scheduling needs.
Application scenario: software release planning
A software team can use ONES Project to connect epics, tasks, sprints, defects, approvals, and release milestones. A project lead can compare the planned release path with current progress and identify unfinished dependencies.
For example, a testing milestone may appear at risk because several defects remain open. The team can then inspect ownership, priority, and sprint capacity without recreating the delivery picture manually.
Application scenario: product launch coordination
A launch team can track packaging, campaign preparation, sales enablement, training, compliance review, and public release dates in one timeline.
Marketing may need the same milestone view as product and operations, while each group maintains its own task details. That shared perspective makes cross-team handoffs easier to discuss.
Application scenario: restricted-network project work
An organization operating in a restricted network can deploy ONES.com through an On-Premise, Private Cloud, or Air-gapped option. The team can maintain planning, reporting, and workflow practices within its approved environment.
This matters when security requirements affect where project work can run. The team does not have to treat deployment constraints as a reason to abandon structured schedule tracking.
Common Challenges
Challenge: The schedule becomes outdated
Why it happens: Updates are irregular, status definitions are unclear, or nobody owns schedule maintenance.
Practical solution: Assign update responsibility, define status meanings, and establish a review rhythm. Keep the routine short enough that people can follow it consistently.
Challenge: Every task appears equally important
Why it happens: The timeline contains activities but does not show milestones, dependencies, or critical work clearly.
Practical solution: Highlight delivery milestones, identify tasks with little schedule flexibility, and review predecessor relationships before discussing less urgent activities.
Challenge: Teams report optimistic percentages
Why it happens: People may count effort already spent instead of measuring accepted work remaining.
Practical solution: Pair percentage completion with a short status note, remaining activities, and the next expected outcome. A concrete statement is easier to evaluate than a number alone.
Challenge: Scope changes distort the original plan
Why it happens: New requests enter the project without showing their effect on capacity or dates.
Practical solution: Add approved changes visibly, record their schedule impact, and decide whether to adjust scope, resources, or the delivery date.
Challenge: Stakeholders cannot read the timeline quickly
Why it happens: The view contains excessive detail or uses colors without clear meaning.
Practical solution: Create audience-specific views. Show milestones and major workstreams to executives, while giving delivery teams the task-level detail they need.
FAQs
How is a tracking Gantt chart different from a regular Gantt chart?
A regular Gantt chart often focuses on the planned schedule. A tracking version adds current progress, actual dates, completion status, and variance against the original plan.
This lets you see whether work is proceeding as expected. It also helps you spot a likely delay before a major milestone is missed.
How often should I update the timeline?
Update active work as often as the project changes. Daily updates may suit software delivery or urgent launches, while weekly updates may suit longer planning cycles.
The most important factor is consistency. A weekly update that reflects reality is more useful than a daily routine that people skip or complete carelessly.
Should I track every task in the project?
Track tasks that affect delivery, ownership, dependencies, milestones, approvals, or risk. Avoid adding tiny activities that create maintenance effort without improving decisions.
For a large project, use summary activities for leadership reporting and detailed activities for the people doing the work. Both levels should connect to the same schedule.
What should I do when a task is late?
First, confirm whether the task is genuinely late against the approved baseline. Then identify the cause, remaining effort, affected dependencies, and likely effect on milestones.
After that, choose a response. You may need to reassign work, change sequence, reduce scope, add capacity, or communicate a revised forecast.
Can a tracking timeline support agile projects?
Yes. Agile teams can use a timeline for releases, epics, dependencies, milestones, and cross-team planning while managing daily work through sprints or boards.
The timeline should provide a higher-level delivery view. It does not need to replace sprint planning, backlog refinement, or team-level conversations.
What is the best way to present schedule variance?
Show the original planned date, the current forecast, and the reason for the difference. Add the affected milestone and the action owner when a recovery decision is needed.
For example, “Security review moved from July 8 to July 11 because two findings require remediation; the release owner will confirm the revised launch date Thursday” is more useful than “Review delayed.”
Conclusion
A tracking Gantt chart helps you compare the plan with reality, understand schedule variance, and act before delays spread. The strongest version includes clear tasks, realistic dates, ownership, dependencies, milestones, actual progress, and an approved baseline.
Start with the seven-step process: define the outcome, break down the work, estimate durations, connect dependencies, preserve the baseline, update progress, and respond to variance.
But here’s the truth: the visual timeline alone will not rescue an unclear workflow. Your team needs consistent updates, useful status definitions, and decisions tied to visible project signals.
When your project grows beyond simple planning, a platform such as ONES.com can bring timeline management, workflows, reporting, sprint planning, automation, and knowledge management into a more connected working environment. That gives you a clearer way to plan the work, track what is happening, and keep delivery moving.