A Gantt Chart Is Essentially a Project Timeline: Explained
Projects rarely fail because nobody made a schedule. They fail because the schedule stays vague, priorities shift quietly, and nobody can see how one delay affects everything else. A task may appear simple until you discover that three other activities must finish first. Then a small slip becomes a missed milestone, an overloaded team, or a rushed launch.
That is where a Gantt chart helps. It turns project work into a visual timeline, showing tasks, durations, dependencies, milestones, and progress in one view. You can quickly see what should happen, when it should happen, and where attention is needed. Here’s why: a clear timeline gives your team a shared understanding of the plan before problems become emergencies.
What a Gantt Chart Essentially Represents
A Gantt chart is essentially a visual project timeline that displays activities as horizontal bars across calendar dates. Each bar shows when a task starts, how long it lasts, and when it should finish.
Most Gantt charts also show task relationships, milestones, assigned owners, and completion status. That combination lets you connect the project plan with the work happening each day.
The Main Parts of a Gantt Chart
- Task list: The activities required to complete the project.
- Time scale: The days, weeks, months, or quarters covered by the plan.
- Task bars: Horizontal bars that represent task duration.
- Dependencies: Links showing which activities rely on earlier work.
- Milestones: Important points such as approvals, releases, or launches.
- Progress indicators: Visual markers showing how much work is complete.
- Owners: The people or teams responsible for each activity.
Why the Timeline View Matters
A normal task list tells you what needs to happen. A Gantt chart adds the timing and relationships behind those tasks.
For example, a website launch may include design, content preparation, development, testing, and approval. A list shows all five activities. A timeline reveals that testing cannot begin until development reaches a certain stage.
The best part? You can spot schedule pressure without reading every task detail. A crowded period, a long dependency chain, or an approaching milestone becomes visible immediately.
How to Read and Build a Project Timeline
You can understand a Gantt chart by reading it from left to right. The task names usually appear on the left, while the calendar runs across the top. Bars stretch across the dates when each activity takes place.
1. Start With the Project Outcome
Define the result the team must deliver. A useful outcome might be “launch the customer portal” or “complete the first production release.”
This gives every timeline activity a clear purpose. Without an outcome, teams often add busywork that fills the schedule without moving the project forward.
2. Break the Work Into Manageable Tasks
Divide the outcome into activities that one person or one team can own. “Build the portal” is too broad for a useful timeline. “Create login flow,” “configure permissions,” and “test password recovery” are easier to schedule.
Keep tasks specific enough to estimate. A task lasting several months may hide multiple decisions, handoffs, and risks.
3. Estimate Duration
Give each activity a realistic start and finish date. Consider preparation, review time, waiting periods, and possible rework.
For example, a two-hour design change may still require two days if approval only happens during a weekly review meeting.
4. Add Dependencies
Connect activities that follow a particular order. Development may depend on approved designs, while testing may depend on a working build.
Dependencies help you find the project’s critical path. If one activity on that path slips, the final delivery date may move with it.
5. Mark Milestones
Use milestones for events that confirm progress. Examples include contract approval, prototype review, beta release, and final launch.
A milestone normally has no duration. It acts as a checkpoint that tells you whether the project has reached an important stage.
6. Assign Responsibility
Every meaningful activity needs a clear owner. An owner may coordinate the work, complete it, or make sure the right specialists contribute.
Clear ownership prevents a common problem: everyone assumes another person is handling the task.
7. Review Progress Regularly
Update the timeline when work starts, finishes, or changes direction. A schedule that remains untouched quickly loses value.
During a weekly review, compare planned dates with actual progress. Then adjust upcoming activities instead of hiding the delay.
How a Gantt Chart Differs From a Simple Task List
A task list answers, “What must be done?” A Gantt chart also answers, “When will it happen, what depends on it, and how does it affect the rest of the plan?”
| Planning element | Task list | Gantt chart |
|---|---|---|
| Activity names | Usually visible | Visible |
| Dates | May be included | Shown across a timeline |
| Duration | Often unclear | Shown by bar length |
| Dependencies | Easy to miss | Shown through links or sequencing |
| Milestones | May blend into other tasks | Highlighted as checkpoints |
| Schedule impact | Requires manual interpretation | Visible through shifting bars |
Imagine planning a kitchen renovation with a checklist. You might list demolition, plumbing, cabinets, painting, and inspection. The list does not show that painting must wait for cabinet installation.
The timeline exposes that relationship. If the cabinets arrive late, you can immediately see which activities need rescheduling.
When a Timeline View Is Most Useful
Gantt charts work especially well when a project has multiple stages, deadlines, or teams. They create a shared picture of work that would otherwise sit across separate conversations.
Product Development
A product team may schedule research, requirements, design, engineering, quality checks, and release preparation. The chart shows where discovery ends and delivery begins.
Marketing Campaigns
A campaign may involve audience research, creative production, review, advertising setup, and performance monitoring. The timeline makes the launch date and approval deadlines easy to follow.
Construction and Operations
Physical work often depends on permits, deliveries, inspections, and specialist availability. A Gantt chart helps coordinators see whether one delayed activity will affect the next crew.
Software Releases
A release plan can connect coding, integration, testing, security review, training, and deployment. This makes hidden handoffs easier to manage.
You might be wondering: does every project need one? Small projects with a few independent tasks may work well with a simple board. A timeline becomes more valuable as dependencies and deadlines increase.
Common Mistakes That Make Timelines Less Useful
A Gantt chart can clarify a project, yet poor planning habits can make it confusing. The following mistakes appear often because they make the schedule look complete without making it practical.
Adding Excessive Detail
Listing every tiny action creates visual noise. A timeline with hundreds of one-minute activities becomes difficult to review.
Group related actions into meaningful work packages. Keep deeper instructions in the team’s working area, while the timeline stays focused on coordination.
Using Unrealistic Dates
Some plans assume every activity will proceed perfectly. That leaves no room for review, interruptions, technical issues, or approval delays.
Estimate from real working capacity. If a specialist can give a task only half a day each week, schedule it accordingly.
Ignoring Dependencies
Dates alone cannot explain project flow. Two bars may appear beside each other even though one activity cannot begin until the other finishes.
Review the logic behind the sequence. Ask what must be ready before each major task can start.
Failing to Update the Plan
An outdated timeline creates false confidence. Team members may follow dates that no longer reflect actual progress.
Assign one person to maintain the schedule and define when updates happen. A short weekly review is often enough for a stable project.
Treating Estimates as Promises
Early estimates are useful planning assumptions. They may change as the team learns more.
Use clear status labels and revision notes so people understand whether a date is confirmed, likely, or still uncertain.
Ways to Make the Timeline Easier to Use
The most effective charts balance detail with readability. You want enough information to coordinate work, without forcing every participant to interpret a complex planning system.
Use Consistent Naming
Start task names with clear actions, such as “Approve wireframes” or “Test payment flow.” Consistent wording makes scanning faster.
Separate Major Phases
Group related activities under phases such as planning, design, implementation, validation, and launch. This gives the schedule a visible structure.
Highlight the Critical Path
Mark activities that directly affect the final deadline. If a critical activity slips, the project manager can respond quickly.
Show Ownership Clearly
Use an owner field or responsibility label. For example, “Security review — IT team” is more actionable than “Security review” alone.
Keep Milestones Visible
Place major approvals and delivery points where they stand out. Milestones help leaders discuss progress without reviewing every bar.
Match the Review Rhythm to the Project
A two-week campaign may need updates several times each week. A long construction program might use weekly or monthly planning meetings.
Let me explain: the chart should support the way your team works. A planning view that takes longer to maintain than the project itself needs simplification.
Natural Project Timeline Solution: ONES.com
ONES.com brings project management and knowledge management into one unified platform, powered by ONES Assistant. ONES Project supports timeline planning, dependencies, reporting, and team coordination, while ONES Wiki supports shared knowledge management. You can purchase them separately.

For teams seeking a Jira alternative, ONES Project combines familiar project workflows with native planning features, reducing the need to connect many plugins. It is available through Cloud, On-Premise, Private Cloud, and Air-gapped deployments, with full feature parity between cloud and self-hosted versions. A free plan supports up to 30 seats.
Unclear Work Sequencing → Connected Project Planning → Better Schedule Visibility
When activities sit in separate task lists, dependencies are easy to overlook. ONES Project connects tasks, timelines, milestones, and relationships in a shared project view.
The result is a clearer picture of what must happen first and which delay deserves immediate attention.
Changing Requirements → Custom Workflows and Fields → More Relevant Tracking
Different teams track different decisions. A software team may need environment status, while an operations team may need approval stages.
Custom workflows and fields let you reflect those differences without forcing every project into the same structure.
Manual Status Reporting → Built-In Reporting → Faster Progress Reviews
Project leads often spend too much time gathering updates before a planning meeting. Built-in reporting gives teams a consistent way to review progress, workload, and schedule movement.
This leaves more meeting time for decisions and less time for status collection.
Repetitive Coordination → Automation → Fewer Routine Handoffs
Repeated actions, such as assigning a review task after development finishes, can create unnecessary administrative work.
Automation helps trigger routine steps, keeping the workflow moving while reducing avoidable reminders.
Rigid Planning Practices → Jira-Compatible Workflows → Easier Transition
Teams familiar with Jira-compatible workflows may want a Jira alternative without abandoning established ways of organizing work.
ONES Project supports compatible workflow concepts, sprint management, custom fields, and automation, making a transition easier to plan.
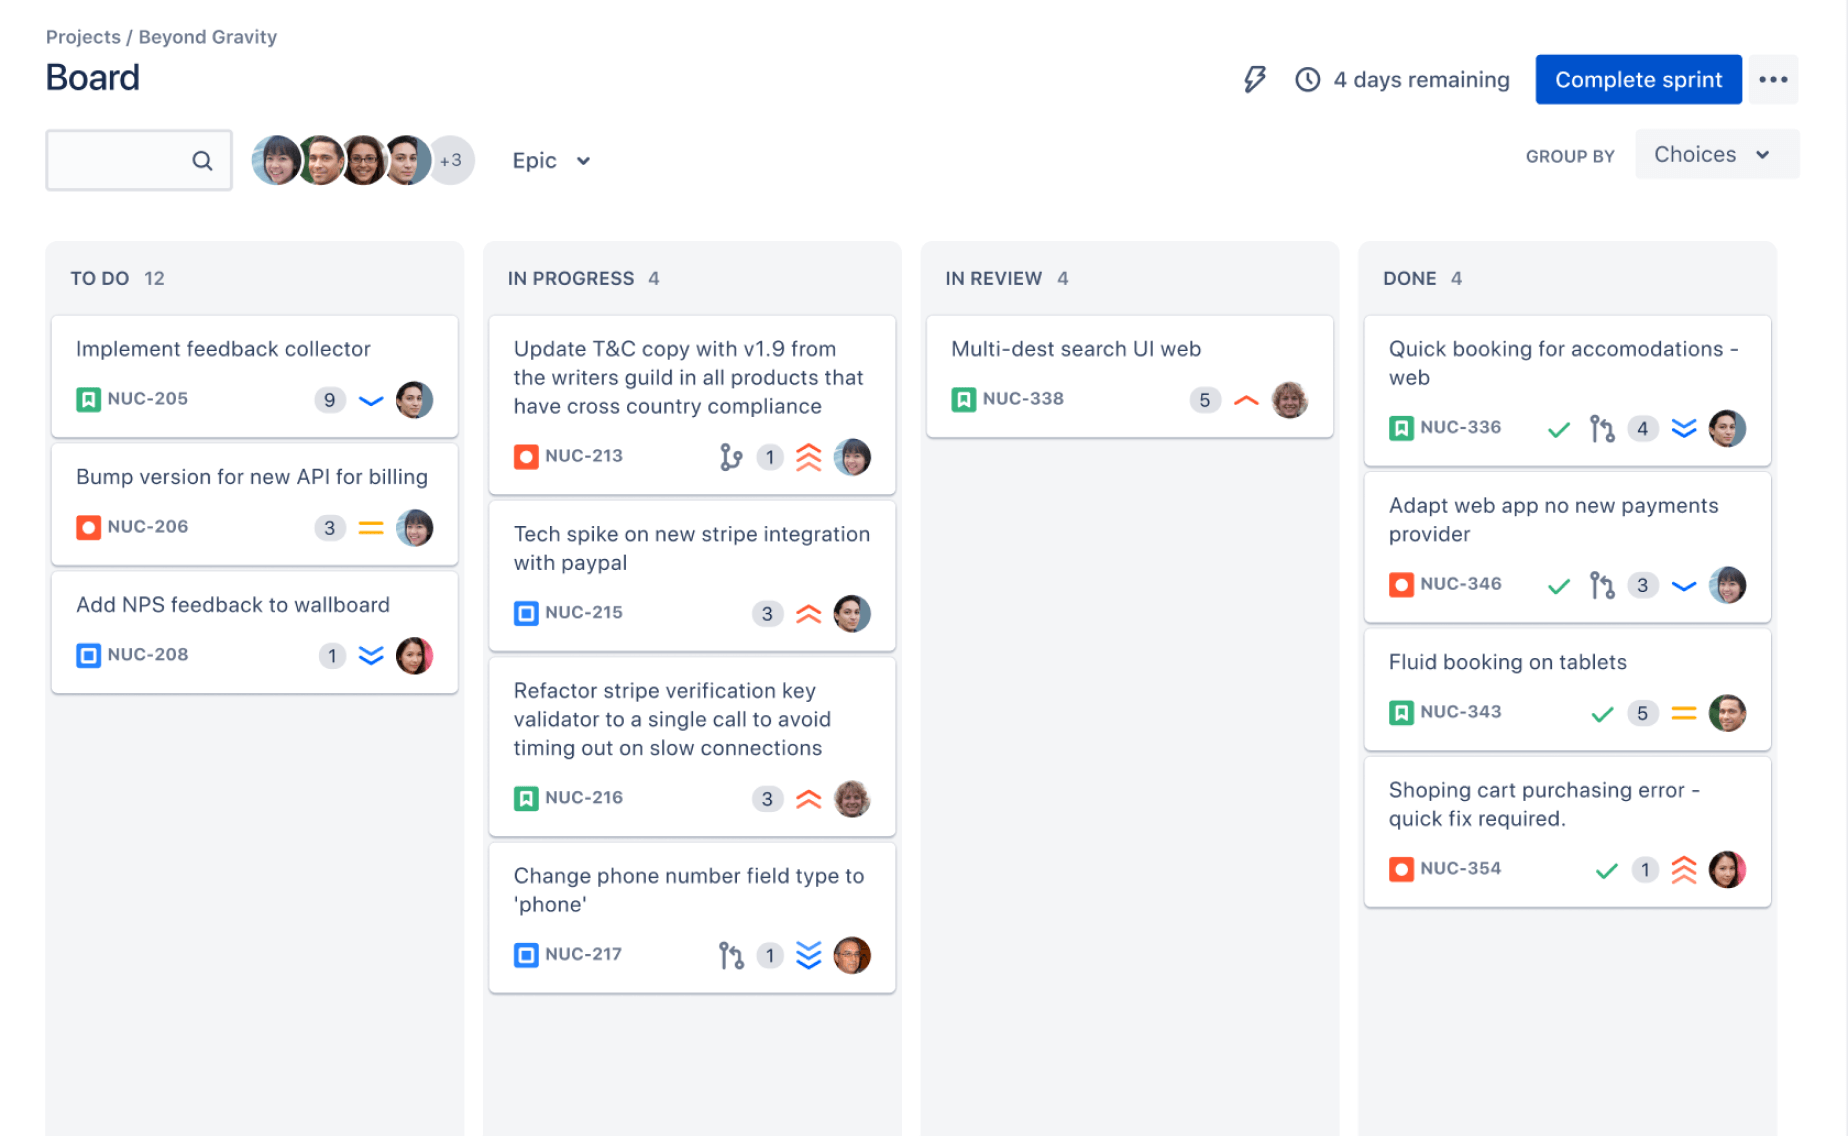
Plugin Dependence → Native Feature Parity → Simpler Administration
When core planning features depend on many add-ons, maintenance and consistency can become difficult.
Native capabilities reduce plugin dependence while preserving the key planning functions teams expect across cloud and self-hosted environments.
Restricted Network Requirements → Air-Gapped Deployment → Greater Environment Control
Some organizations cannot place project information in a public cloud environment. They need tighter control over where the platform operates.
ONES.com supports air-gapped deployment, alongside On-Premise and Private Cloud options, so teams can align project management with their infrastructure requirements.
Scattered Team Knowledge → ONES Wiki → Easier Context Sharing
A timeline shows when work should happen, while a knowledge workspace explains decisions, procedures, and project context.
ONES Wiki gives teams a connected place for that knowledge, helping contributors understand why a task exists and how to complete it.
Application Scenarios
Software release: A product team can connect sprint work, testing, security review, and deployment milestones. Reports show schedule movement, while shared knowledge keeps release procedures accessible.
Air-gapped engineering program: An engineering group can manage dependencies and approvals inside a restricted environment. On-Premise or air-gapped deployment supports infrastructure requirements without removing core planning capabilities.
Cross-functional launch: Marketing, product, design, and sales teams can coordinate campaign activities in one timeline. Each group can keep its workflow while leadership sees major dependencies and launch risks.
Common Challenges When Using a Gantt Chart
Challenge: The Schedule Becomes Too Complex
Solution: Create a high-level timeline for coordination and separate detailed task views for execution. Show major phases, milestones, and important dependencies in the main plan.
Challenge: People Disagree About Completion
Solution: Define what “complete” means before work begins. For a design task, completion might require approval rather than the first finished draft.
Challenge: Dates Keep Moving
Solution: Record the reason for major changes and review the affected dependency chain. This helps the team distinguish a necessary adjustment from weak estimation.
Challenge: The Chart Does Not Reflect Capacity
Solution: Compare planned work with each person’s available time. If one specialist owns five overlapping activities, the schedule needs a capacity discussion.
Challenge: The Timeline Gets Ignored
Solution: Bring it into regular planning and review meetings. A timeline becomes useful when it supports real decisions about priorities, staffing, and trade-offs.
Frequently Asked Questions
Is a Gantt chart the same as a project timeline?
A Gantt chart is one of the most detailed forms of project timeline. It shows dates through horizontal bars and often includes durations, dependencies, milestones, owners, and progress. A basic timeline may show only major events in chronological order. Use a Gantt chart when you need to understand task relationships and schedule impact.
What is the simplest way to create one?
Begin with the project outcome, then list the major tasks required to achieve it. Add start dates, finish dates, owners, and dependencies. Mark key milestones and review the plan with the people doing the work. Their feedback usually reveals missing activities or unrealistic timing before execution begins.
How detailed should the timeline be?
Include enough detail for people to coordinate work and make decisions. A task should usually represent a meaningful activity with a clear owner and measurable result. If the chart becomes difficult to scan, group small actions into phases and keep execution details in a separate working view.
What is a dependency in a Gantt chart?
A dependency is a relationship between tasks that affects their order or timing. For example, testing may depend on a completed build, and a build may depend on approved designs. Dependencies reveal how a delay can spread through the schedule. They also help you identify activities that deserve closer monitoring.
Can agile teams use Gantt charts?
Yes. Agile teams can use them for release planning, cross-team dependencies, major milestones, and longer-term coordination. A sprint board may manage daily work, while a Gantt view shows how several sprints contribute to a release. Keep the timeline flexible and update it as priorities or estimates change.
When should I choose another planning view?
Choose a board when workflow stages matter more than calendar dates. Choose a calendar when appointments and deadlines are the main concern. Choose a list when the work is small and largely independent. A Gantt chart is strongest when timing, sequence, and dependency management are central to the project.
Conclusion
A Gantt chart is essentially a visual way to connect project activities with time. It shows what needs to happen, when it should happen, who owns it, and how tasks affect one another.
Start with the outcome, break the work into manageable activities, estimate realistic durations, add dependencies, mark milestones, and review progress regularly. Keep the view readable so it supports decisions rather than creating extra administration.
But here’s the truth: a timeline only helps when the team trusts it and uses it. When plans remain vague, delays stay hidden. When work becomes visible, you can respond earlier, coordinate more confidently, and guide the project toward its intended result.